
How to Interpret Syslog Messages for Network Monitoring
This post breaks down the structure of syslog messages, explaining how to read the timestamp, facility, severity level, and description fields. It covers the eight syslog severity levels and shows how to configure syslog on a Cisco router, with a practical log interpretation example to tie it all t

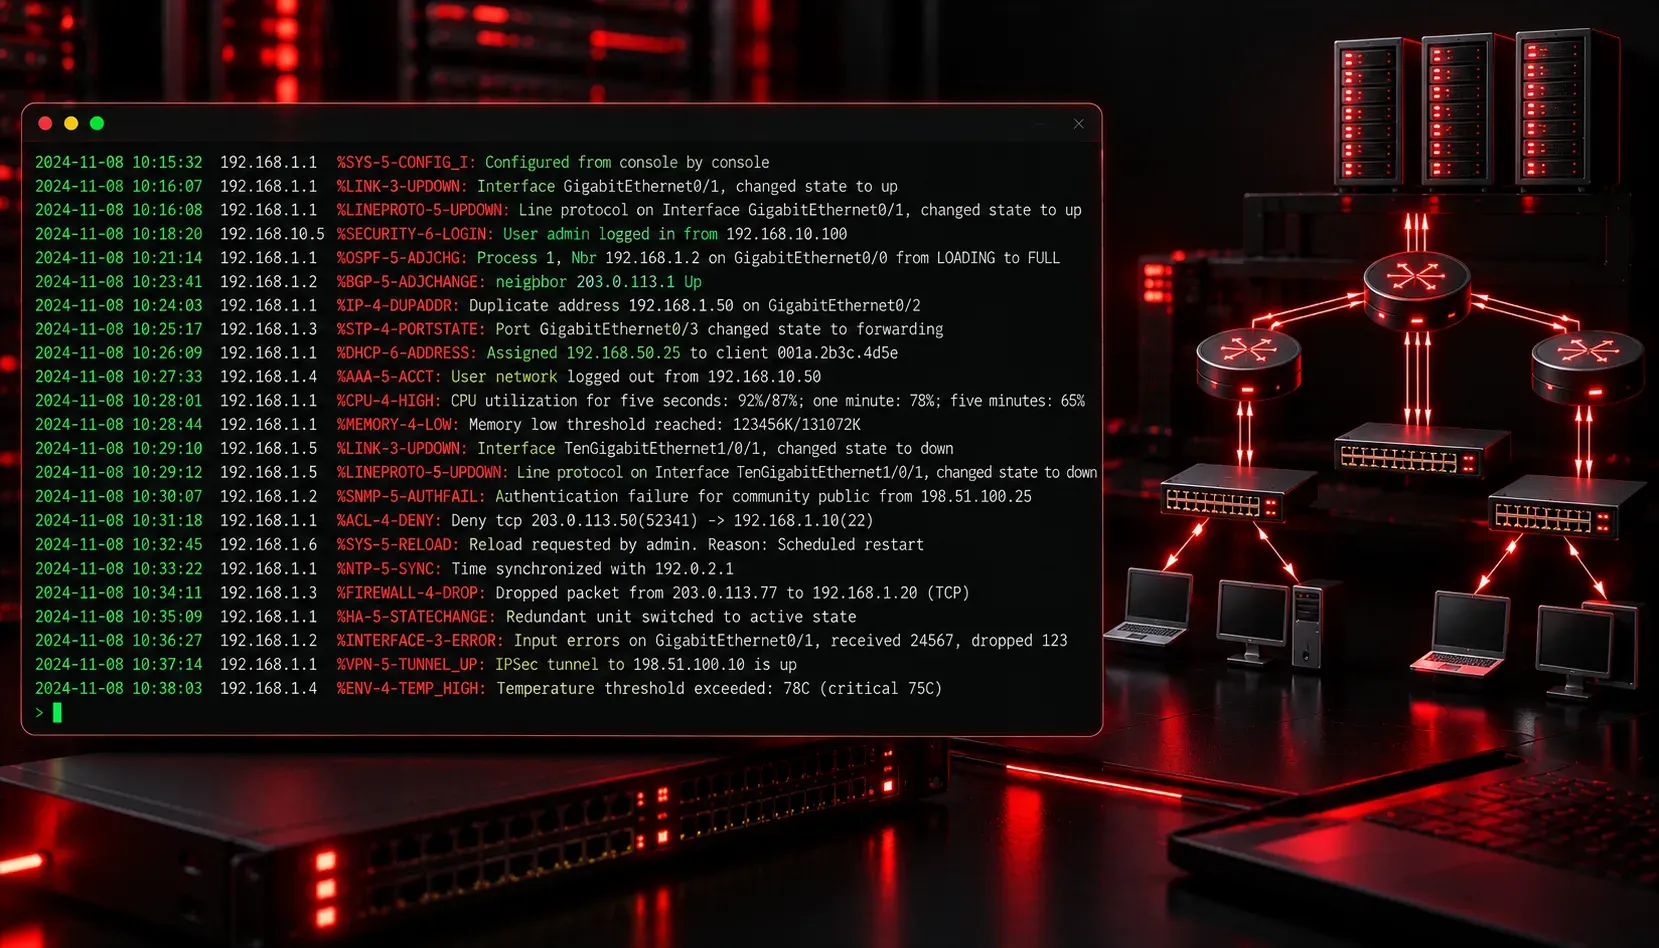
When something goes wrong on your network, syslog messages are often the first place you look. But if you have never read one before, they can look like a jumbled string of codes and text. Once you understand the structure, though, syslog analysis becomes one of the most powerful tools in your network monitoring toolkit.
What Is Syslog?
Syslog is a standardized protocol that network devices use to send log messages to a central logging server or display them locally on the console. Routers, switches, firewalls, and other network devices all generate syslog messages when noteworthy events occur: interface state changes, authentication failures, configuration changes, and much more.
For the CCNA exam (and in real-world practice), you need to know how to interpret syslog messages so you can quickly assess what happened, when it happened, and how serious it is.
The Anatomy of a Syslog Message
Every syslog message follows a consistent format. Here is an example from a Cisco router:
*Mar 1 12:34:56.789: %LINK-3-UPDOWN: Interface GigabitEthernet0/0, changed state to downLet's break this down piece by piece.
Timestamp
The first part, *Mar 1 12:34:56.789, is the timestamp. The asterisk (*) indicates the clock has not been synchronized with NTP. Once NTP is configured and working, the asterisk disappears. Accurate timestamps are critical for correlating events across multiple devices during log interpretation.
Facility and Severity
The section %LINK-3-UPDOWN contains three key pieces of information separated by hyphens:
- Facility (
LINK): identifies which process or subsystem on the device generated the message. Common facilities includeLINK,OSPF,SYS, andSEC. - Severity level (
3): a number from 0 to 7 that indicates how critical the message is. - Mnemonic (
UPDOWN): a short code that describes the specific event type.
Syslog Severity Levels
The severity level is arguably the most important field for network monitoring. Cisco uses the standard syslog severity scale:
- 0 - Emergency: system is unusable
- 1 - Alert: immediate action required
- 2 - Critical: critical conditions
- 3 - Error: error conditions (like our example above)
- 4 - Warning: warning conditions
- 5 - Notice: normal but significant condition
- 6 - Informational: informational messages
- 7 - Debug: debug-level messages
A helpful mnemonic for memorizing these levels is: Every Awesome Cisco Engineer Will Need Daily Breaks (Emergency, Alert, Critical, Error, Warning, Notice, Debug... with Informational sitting between Notice and Debug).
In practice, severity levels 0 through 3 demand immediate attention. Levels 4 and 5 are worth monitoring. Levels 6 and 7 are useful for troubleshooting but generate a high volume of output.
Description
The final part, Interface GigabitEthernet0/0, changed state to down, is the human-readable description of the event. This is what tells you exactly what happened. Combined with the facility and mnemonic, you get a complete picture of the event.
Configuring Syslog on a Cisco Device
You can control where syslog messages go and which severity levels are captured using a few key commands:
Router(config)# logging console 6
Router(config)# logging buffered 4
Router(config)# logging host 192.168.1.100
Router(config)# logging trap 5
Here, logging console 6 sends informational and higher-priority messages to the console. logging buffered 4 stores warning-level and higher messages in local memory. logging host points messages to a remote syslog server, and logging trap 5 controls what gets sent to that server.
To view messages stored in the buffer, use:
Router# show loggingA Practical Log Interpretation Example
Imagine you see this in your log file:
Mar 5 09:15:22.441: %SEC_LOGIN-4-LOGIN_FAILED: Login failed [user: admin] [Source: 10.0.0.5] [localport: 22] [Reason: Login Authentication Failed]Breaking it down: the facility is SEC_LOGIN, the severity is 4 (Warning), and the mnemonic is LOGIN_FAILED. The description tells you someone at IP address 10.0.0.5 failed to log in via SSH as admin. One failure might be a typo. Dozens of these in a short period could indicate a brute-force attack. That is the value of syslog analysis: context turns raw data into actionable intelligence.
What's Next
Now that you can read and interpret syslog messages, the next logical step is understanding how NTP (Network Time Protocol) fits into the picture. Accurate timestamps across all your devices are essential for correlating syslog events and building a reliable timeline when troubleshooting. We will cover NTP configuration and verification on Cisco devices in the next post.
Tools and resources for this topic
- CCNA Official Cert Guide (Wendell Odom) — The definitive CCNA study resource. Both volumes cover the 200-301 exam blueprint in full.
- Wendell Odom CCNA Vol 1 — Covers networking fundamentals, switching, and routing basics.
- Wendell Odom CCNA Vol 2 — Covers advanced routing, WAN, infrastructure services, and security.