
Building a Home Lab with Meraki: A Practical Guide
This practical guide walks network engineers through building a Meraki home lab from scratch, covering hardware acquisition, Dashboard setup, a starter topology, and key features to explore. It also introduces the Meraki API as a natural extension of hands-on lab work. Ideal for anyone looking to g

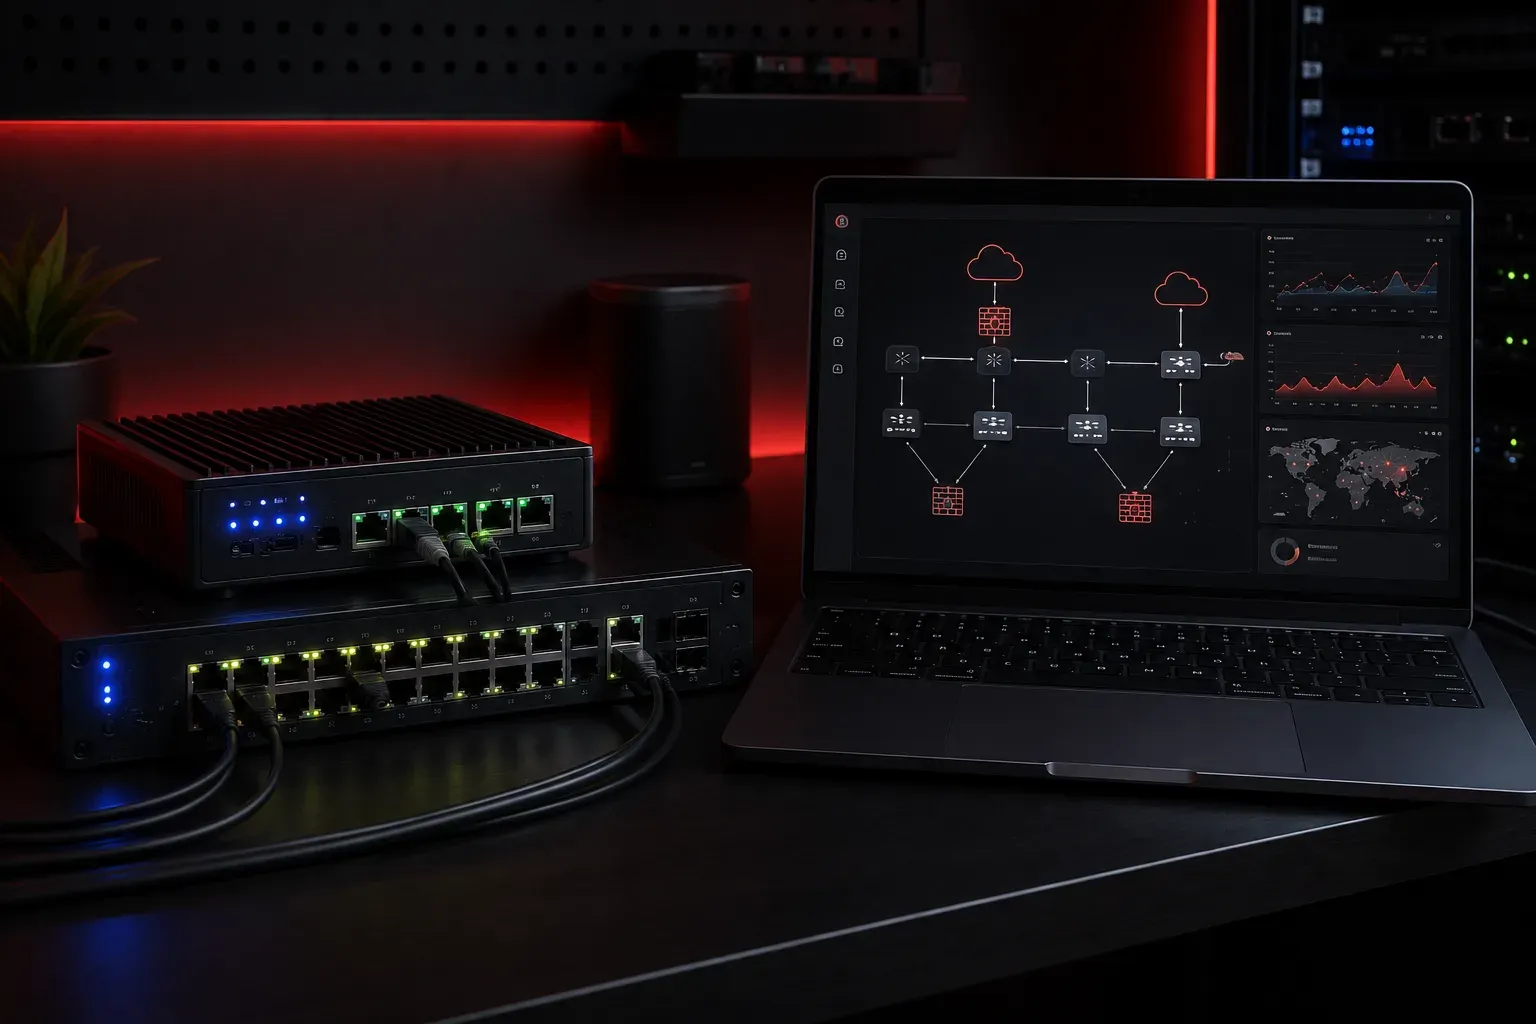
If you've been working with or studying Cisco Meraki in a professional environment, you already know how powerful the platform is. But hands-on time in a production network is limited, and theory only takes you so far. Building a Meraki home lab gives you a safe space to experiment, break things, and truly understand how cloud-managed networks behave without risking anyone's production environment.
This practical guide walks you through what you need, how to get started, and what to focus on once your lab is running.
Why a Meraki Home Lab Is Different
Unlike traditional Cisco gear, Meraki devices are tightly integrated with the Meraki Dashboard. There is no local CLI for configuration (beyond basic troubleshooting commands), and everything meaningful happens through the cloud. This changes what your home lab looks like compared to a classic GNS3 or Packet Tracer setup.
The good news: you don't need a rack full of hardware. Even a single device gives you meaningful hands-on experience with the platform.
Getting Meraki Hardware for Your Lab
New Meraki hardware is expensive, but there are two realistic paths for getting equipment on a budget:
- Cisco Meraki Free Hardware Program: Cisco occasionally offers free demo units to IT professionals through their website at meraki.cisco.com. You get a physical device with a 30-day trial license. This is a great starting point.
- Used equipment from eBay or secondary markets: Older Meraki devices like the
MX64,MR33, orMS220series are widely available at low cost. The catch: Meraki devices require an active license to function. Unclaimed devices (never registered to a dashboard) can sometimes be activated with a new trial or paid license.
Always verify the claim status of any used Meraki device before purchasing. A device tied to a previous organization cannot be reused without Cisco's assistance.
Setting Up Your Dashboard Organization
Your Meraki home lab starts with the Dashboard, not the hardware. Go to dashboard.meraki.com and create a free account. From there:
- Create a new Organization to represent your lab environment.
- Add a Network within that organization. Networks can be combined (MX + MR + MS in one) or separated by device type.
- Claim your hardware using the serial number found on the device label.
Once claimed, the device will appear in your dashboard. Power it on, connect it to the internet, and it will check in automatically. This cloud registration process is one of the first things worth watching in action: Meraki calls it Zero-Touch Provisioning, and seeing it work firsthand is genuinely satisfying.
Recommended Starter Topology
If you're working with a single MX security appliance, a basic lab topology might look like this:
ISP Modem/Router
       |
   [MX64] (WAN uplink)
       |
   LAN Switch
    /      \
PC/VM    Test Device
This gives you a working environment to explore:
- Firewall rules: Build Layer 3 and Layer 7 outbound rules using the
Security and SD-WAN > Firewallsection. - Content filtering: Enable and test category-based web filtering under
Security and SD-WAN > Content Filtering. - Traffic analytics: Watch real-time application detection using the
Network-wide > Clientsview. - VLANs: Create multiple VLANs and inter-VLAN routing policies under
Security and SD-WAN > Addressing and VLANs.
Making the Most of Your Lab Time
Cloud-managed networks shine when you explore features that traditional equipment handles very differently. Focus on these areas during your lab sessions:
- Auto VPN: If you can access a second MX (a friend's lab or a remote site), configure Meraki Auto VPN and watch the tunnel come up in seconds with zero manual IKE configuration.
- SD-WAN policies: Simulate WAN preference rules and traffic shaping using the
SD-WAN & Traffic Shapingsection. - Alerts and logging: Configure email or webhook alerts to understand how Meraki surfaces operational data without traditional syslog deep-dives.
- API exploration: The Meraki Dashboard API is well-documented at developer.cisco.com/meraki. Even pulling a simple device list with Python reinforces how cloud-managed networks expose their data programmatically.
A basic API call to list your organization's networks looks like this:
import requests

api_key = "YOUR_API_KEY"
org_id = "YOUR_ORG_ID"

url = f"https://api.meraki.com/api/v1/organizations/{org_id}/networks"

headers = {
    "X-Cisco-Meraki-API-Key": api_key,
    "Content-Type": "application/json"
}

response = requests.get(url, headers=headers)
print(response.json())
This returns a JSON list of all networks in your organization, and it's a natural entry point for building automation around your lab.
What's Next
Now that your Meraki home lab is up and running, the next logical step is digging into the Meraki Dashboard API in more depth. In the next post, we'll walk through authenticating, navigating the API documentation, and writing practical Python scripts to automate common Meraki tasks like device inventory, client reporting, and configuration changes at scale.