
Advanced Techniques for Configuring Flexible NetFlow
This post covers advanced Flexible NetFlow configuration for enterprise environments, walking through custom flow records, exporter tuning, cache sizing, sampling, and systematic troubleshooting. It targets CCNP ENCOR exam objective 4.2 with production-grade CLI examples throughout.

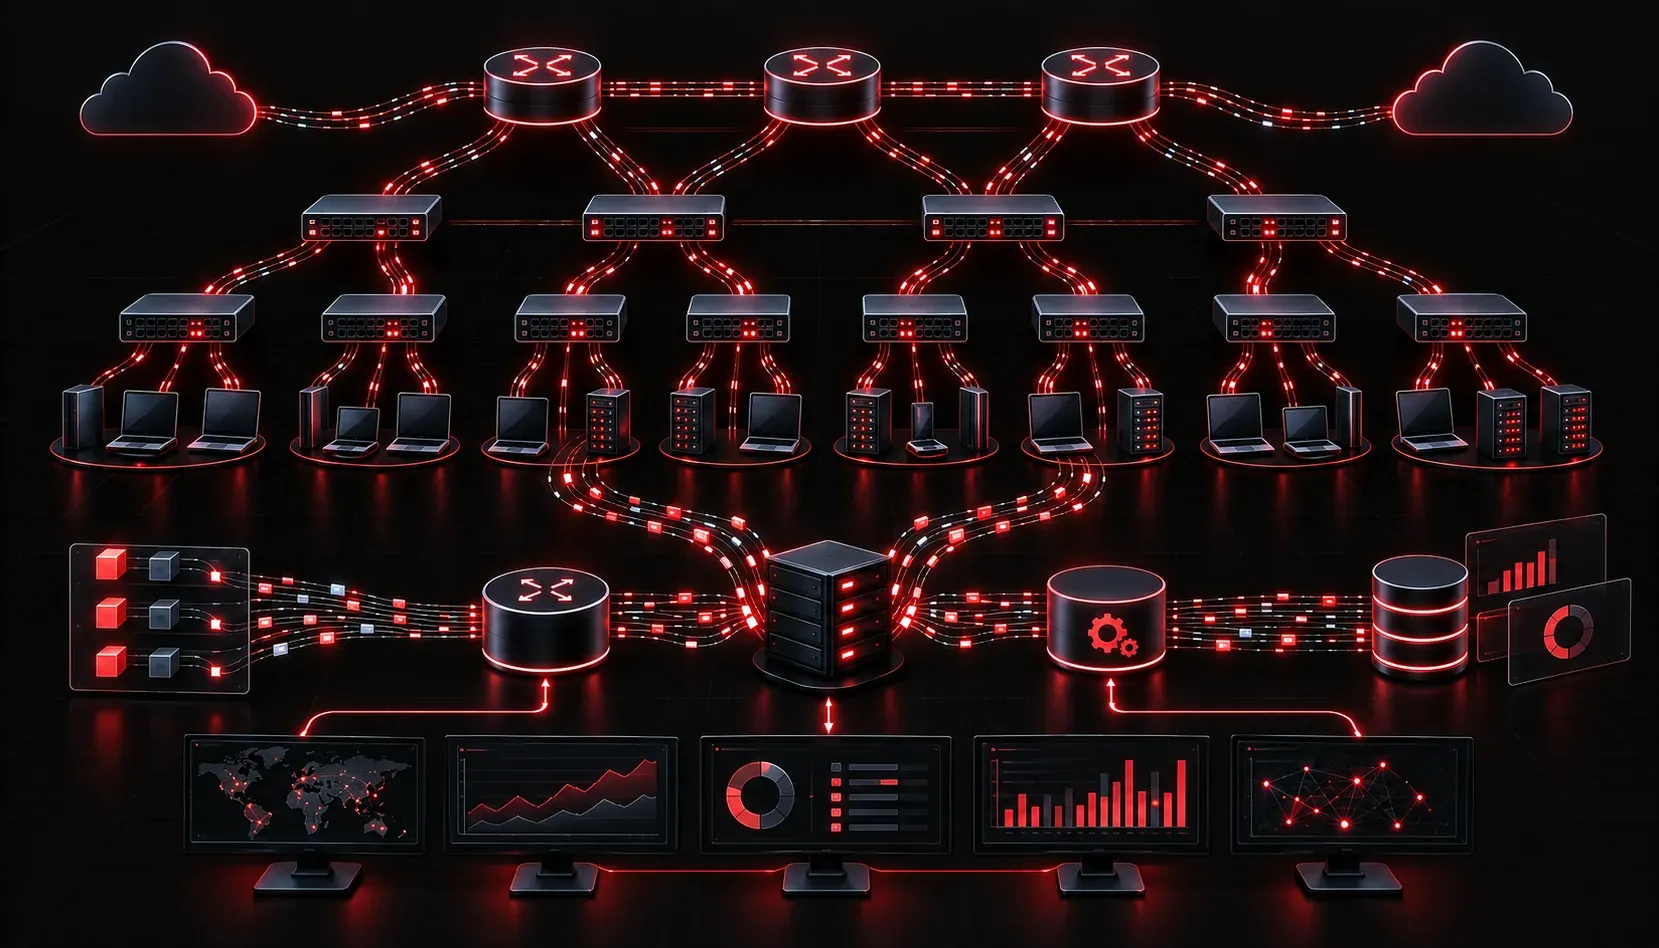
Understanding Flexible NetFlow Architecture Before You Configure
Flexible NetFlow (FNF) replaced the older traditional NetFlow v5/v9 model by giving engineers granular control over exactly what traffic attributes get captured, how they get grouped, and where they get exported. If you are coming from classic NetFlow, the mental model shift is important: instead of a static five-tuple collector feeding a single destination, FNF uses a modular pipeline built from four configurable components that you assemble independently and then bind together on an interface.
Those four components are: the flow record (what fields to capture), the flow exporter (where to send the data and in what format), the flow monitor (the cache that ties a record to one or more exporters), and the optional flow sampler (the rate at which packets are inspected). Understanding this pipeline is essential before touching the CLI, because misconfiguring any one layer silently breaks collection without generating obvious errors.
Defining a Custom Flow Record
The flow record is where advanced NetFlow setup diverges most sharply from what CCNA-level engineers are used to. Rather than accepting a hardcoded five-tuple, you explicitly declare which fields are key fields (used to uniquely identify a flow) and which are non-key fields (metrics collected per flow).
A production-grade record for enterprise network monitoring typically looks like this:
flow record ENTERPRISE-RECORD
 description IPv4 traffic with DSCP and BGP AS tracking
 match ipv4 protocol
 match ipv4 source address
 match ipv4 destination address
 match transport source-port
 match transport destination-port
 match ipv4 tos
 match interface input
 collect routing source as
 collect routing destination as
 collect transport tcp flags
 collect counter bytes long
 collect counter packets long
 collect timestamp sys-uptime first
 collect timestamp sys-uptime last
 collect interface output
A few things to note here. The match ipv4 tos field captures the full DSCP/ECN byte, which is critical for QoS audit trails. The collect routing source as and collect routing destination as fields pull BGP autonomous system numbers into the flow data, enabling upstream peering analysis without a separate BGP monitoring tool. The collect counter bytes long keyword uses 64-bit counters, which you should always prefer over the default 32-bit counters on high-throughput links to avoid rollover errors in your collector.
Configuring the Flow Exporter with Reliability in Mind
The exporter defines where your collector lives and how data gets transported. Most engineers configure this correctly at a basic level but miss several enterprise-critical options:
flow exporter COLLECTOR-PRIMARY
 destination 10.100.50.10
 source Loopback0
 transport udp 2055
 export-protocol netflow-v9
 template data timeout 60
 option interface-table timeout 300
 option vrf-table timeout 300
 option application-table timeout 300
The source Loopback0 line is non-negotiable in a production environment. Binding the exporter to a loopback ensures that SNMP correlation between interface indexes and flow data stays consistent regardless of which physical path UDP datagrams take to the collector. If you source from a physical interface that goes down, the exporter silently stops sending without an explicit error condition.
The template data timeout 60 setting controls how frequently the router retransmits NetFlow v9 templates to the collector. The default is 1800 seconds. In environments where collectors restart frequently or where you are load-balancing across multiple collectors, reducing this to 60 seconds prevents the collector from receiving data records it cannot decode because it missed the original template transmission.
The option statements export SNMP-correlated metadata tables, which allow your collector to resolve interface indexes to human-readable names and map VRF names to flow data. Without these, most enterprise collectors show numeric interface IDs that require manual cross-referencing.
Building the Flow Monitor and Cache Tuning
The flow monitor binds your record and exporter together and controls the local cache behavior:
flow monitor ENTERPRISE-MONITOR
 description Production FNF monitor
 record ENTERPRISE-RECORD
 exporter COLLECTOR-PRIMARY
 cache type normal
 cache entries 16384
 cache timeout active 60
 cache timeout inactive 15
 cache timeout update 30
Cache sizing with cache entries 16384 is the most commonly under-tuned parameter. The default is 4096 entries. On a core router carrying 50,000+ concurrent flows, an undersized cache forces early eviction of active flows, which fragments flow records at the collector and makes traffic analysis unreliable. Use show flow monitor ENTERPRISE-MONITOR cache to check the Cache Utilization percentage. If it consistently exceeds 80 percent, double the entry count.
The three timeout values work together. cache timeout active 60 forces export of long-lived flows every 60 seconds so your collector gets incremental updates rather than a single massive record when a file transfer completes. cache timeout inactive 15 expires flows with no new packets in 15 seconds, which is appropriate for most TCP applications. cache timeout update 30 is specific to the permanent cache type and less commonly used in normal monitoring deployments.
Applying Flexible NetFlow to Interfaces
Interface application is straightforward but direction matters significantly:
interface GigabitEthernet0/0/0
 ip flow monitor ENTERPRISE-MONITOR input
 ip flow monitor ENTERPRISE-MONITOR output
Apply FNF to both directions on edge-facing interfaces. On internal inter-VLAN routed interfaces, applying only input is often sufficient and reduces CPU overhead. On ASR platforms, FNF is hardware-offloaded and direction has less performance impact. On ISR platforms, particularly the ISR 4000 series, applying both directions on high-throughput interfaces can spike process CPU during cache export windows, so monitor accordingly using show processes cpu sorted | head.
Flow Sampling for High-Throughput Environments
On links exceeding 1 Gbps where full flow capture is impractical, use a flow sampler:
flow sampler SAMPLER-1-IN-1000
 mode random 1 out-of 1000

interface GigabitEthernet0/1/0
 ip flow monitor ENTERPRISE-MONITOR sampler SAMPLER-1-IN-1000 input
A 1-in-1000 sampling rate is common for 10G links in enterprise core deployments. The tradeoff is that low-volume flows, such as management traffic or DNS, may not appear in your data. For security monitoring use cases where you cannot afford to miss any flow, full capture on dedicated security monitoring interfaces is preferred over sampling.
Verification and Troubleshooting
Use these commands systematically when flows are not appearing at the collector:
show flow monitor ENTERPRISE-MONITOR statistics: Confirms packets matched and cache activity.show flow exporter COLLECTOR-PRIMARY statistics: Reveals export failures, including unreachable collector errors.show flow record ENTERPRISE-RECORD: Confirms the record structure as the router parsed it.debug flow exporter: Use sparingly in production; confirms UDP export attempts and template sends.
A common failure pattern: the exporter shows zero exported packets despite the monitor showing active cache entries. This almost always means the source interface is unreachable from the router's routing table, or a firewall between the router and collector is blocking UDP 2055. Verify with ping 10.100.50.10 source Loopback0 directly from the router.
What's Next
With Flexible NetFlow configuration locked in, the next logical area to explore under Network Assurance is IP SLA. IP SLA complements NetFlow by providing synthetic traffic generation for proactive performance measurement, which gives you baseline RTT, jitter, and packet loss data that puts your NetFlow traffic analysis in proper context. We will cover advanced IP SLA configuration including threshold-based alerting and integration with Embedded Event Manager in the next post.
Tools and resources for this topic
- CCNP ENCOR 350-401 Official Cert Guide — The definitive ENCOR study resource by Brad Edgeworth. Covers enterprise infrastructure, virtualisation, and automation.