
How to Monitor AI Workflows Effectively
Learn practical methods to monitor AI workflows effectively, including essential tools, key metrics to track, and techniques for identifying performance issues early. Covers logging strategies, alerting systems, and dashboard design for AI workflow monitoring.

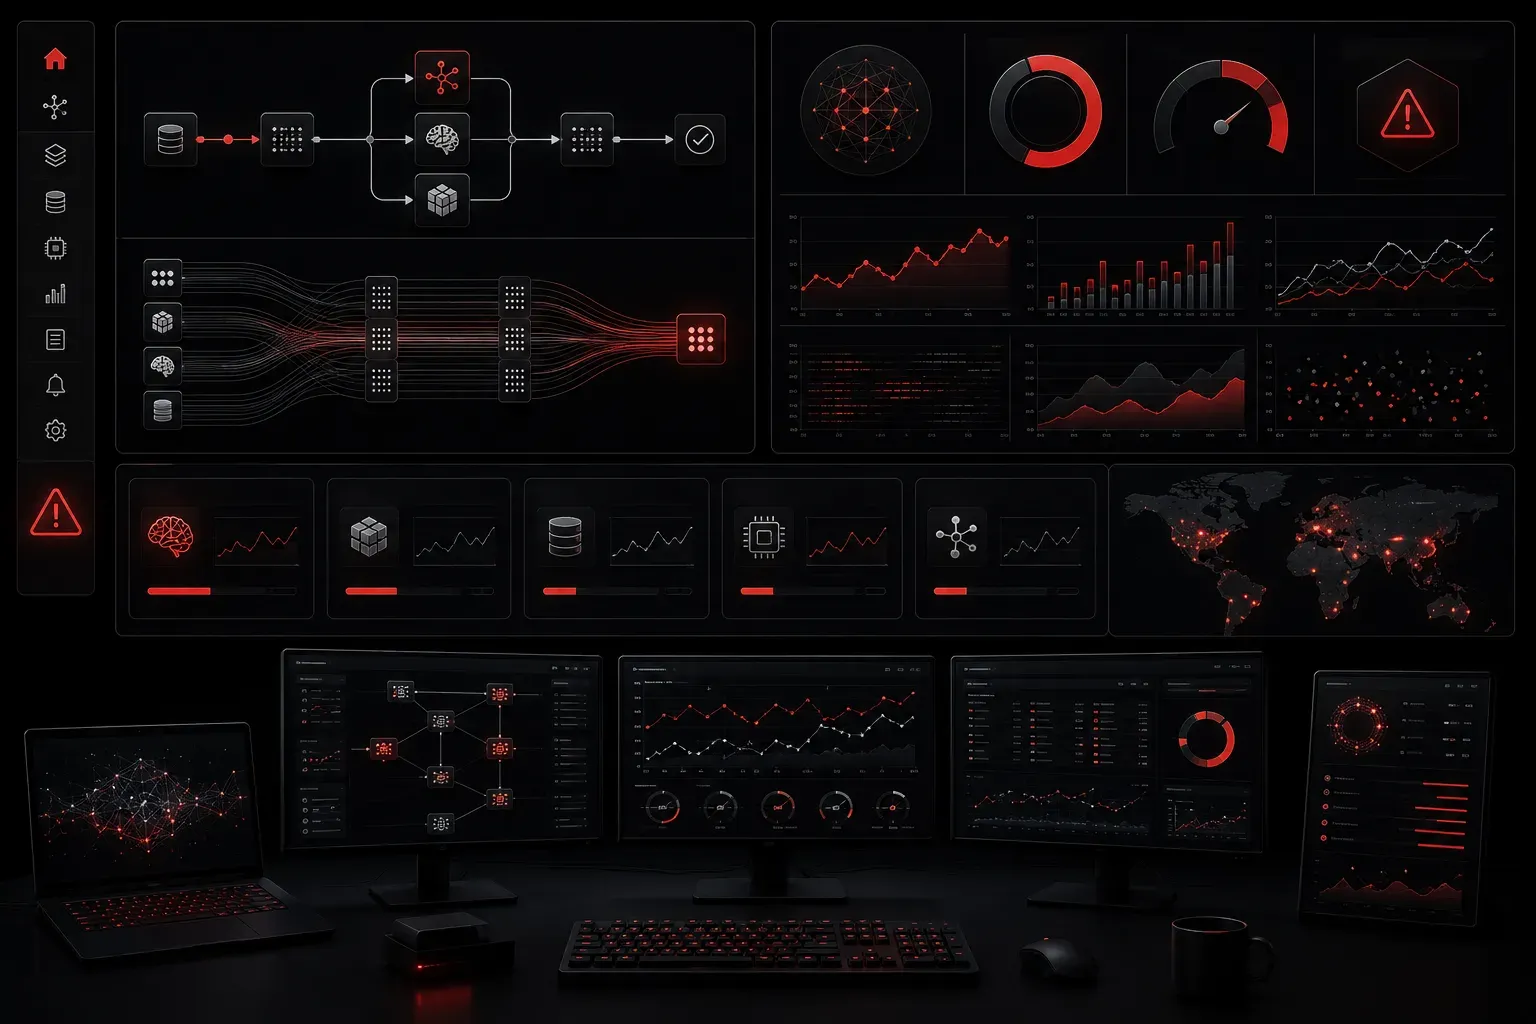
Monitoring AI workflows effectively is crucial for maintaining reliable, high-performing systems. Whether you're running automated data processing pipelines, chatbot interactions, or complex machine learning operations, proper monitoring helps you catch issues before they impact users and ensures your AI systems deliver consistent results.
Understanding AI Workflow Monitoring Fundamentals
AI workflow monitoring goes beyond traditional application monitoring. You need to track not just system performance, but also model accuracy, data quality, and the unique behaviors of AI components. Think of it as having multiple dashboards: one for your infrastructure, one for your data, and one for your AI model performance.
Key areas to monitor include:
- Model Performance: Accuracy, response times, and prediction quality
- Data Quality: Input validation, data drift, and anomaly detection
- System Resources: CPU, memory, GPU utilization, and API rate limits
- Workflow Health: Step completion rates, error frequencies, and bottlenecks
Essential Monitoring Tools and Techniques
Start with logging every critical step in your workflow. Use structured logging with JSON format to make parsing easier later:
{
  "timestamp": "2024-01-15T10:30:00Z",
  "workflow_id": "data-processing-001",
  "step": "model_inference",
  "status": "completed",
  "duration_ms": 245,
  "input_size": 1024,
  "confidence_score": 0.87
}
For real-time monitoring, implement health checks at each workflow stage. Set up alerts for:
- Response times exceeding normal thresholds
- Error rates above acceptable limits
- Model confidence scores dropping significantly
- Resource utilization spikes
Practical Monitoring Implementation
Use tools like MLflow for experiment tracking and model monitoring, or Weights & Biases for comprehensive AI workflow visibility. For simpler setups, combine Prometheus with Grafana for custom metrics dashboards.
Create custom metrics that matter for your specific use case. For example, if you're monitoring a document processing workflow, track metrics like:
# Document processing metrics
documents_processed_total
processing_errors_by_type
average_processing_time
model_confidence_distribution
Identifying and Addressing Common AI Issues
Performance monitoring helps you spot patterns that indicate problems. Watch for gradual degradation in model performance, which often signals data drift or model staleness. Sudden spikes in error rates might indicate infrastructure issues or unexpected input formats.
Set up automated alerts for critical thresholds. For instance, if your model's accuracy drops below 85% or processing times exceed 2 seconds, trigger immediate notifications. This proactive approach prevents small issues from becoming major problems.
Building Effective Dashboards
Create dashboards that tell a story about your workflow health. Include:
- High-level KPIs: Overall success rate, average response time, daily throughput
- Detailed breakdowns: Performance by workflow step, error categories, resource usage
- Trend analysis: Week-over-week comparisons, seasonal patterns, improvement tracking
Remember that effective monitoring is about actionable insights, not just data collection. Each metric should answer a specific question about your workflow's health and performance.
What's Next
Now that you understand monitoring fundamentals, the next step is optimizing your AI workflows based on the insights you gather. We'll explore performance tuning techniques and how to use monitoring data to make your workflows faster, more reliable, and cost-effective.