
What are Cloud-Managed Networks?
Cloud-managed networks like Cisco Meraki centralize network management through a cloud-based dashboard, simplifying configuration, monitoring, and troubleshooting. This post explains how Meraki works, its key features, and why it matters for the CCST Networking exam's Diagnosing Problems domain.

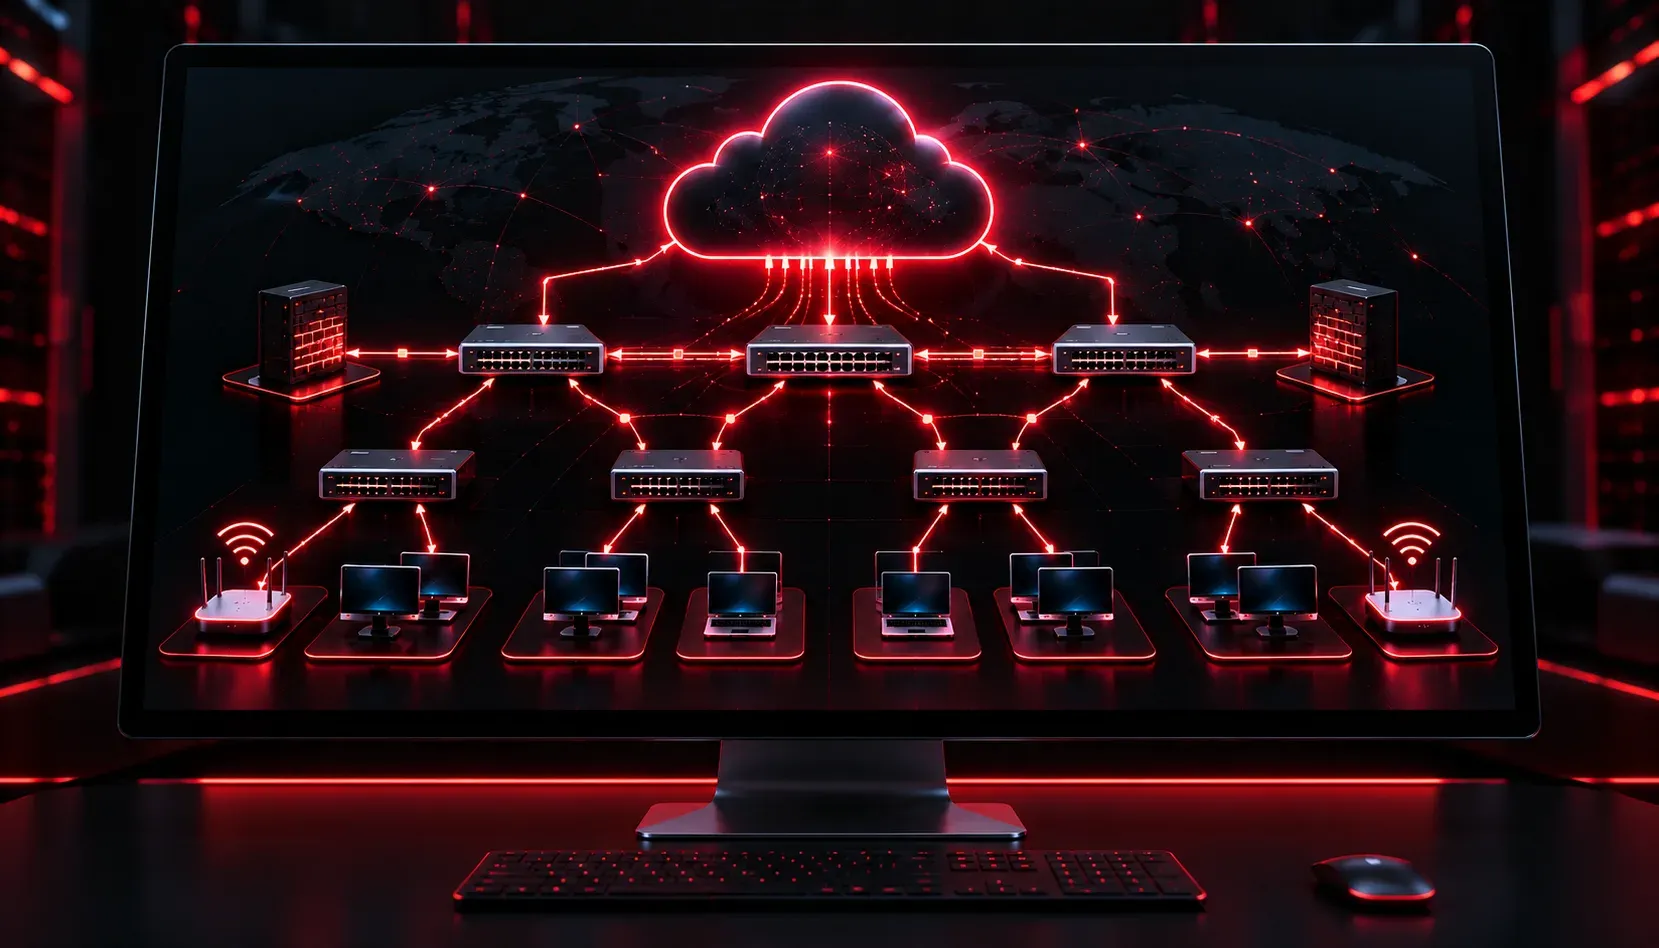
Traditional network management often means logging into each device individually, remembering IP addresses, and manually checking configurations one router or switch at a time. Cloud-managed networks take a completely different approach, and understanding this concept is an important part of the CCST Networking exam.
What Is a Cloud-Managed Network?
A cloud-managed network is one where the configuration, monitoring, and troubleshooting of network devices happens through a centralized cloud-based platform rather than directly on each device. Instead of connecting to a switch via console cable or SSH, an administrator logs into a web dashboard hosted in the cloud and manages everything from there.
Think of it like this: instead of visiting each store in a chain to check the inventory, a manager reviews everything from a single headquarters dashboard. The concept is the same for cloud-managed networks. All your devices report their status to the cloud, and all your configuration changes flow back down from the cloud to the devices.
Cisco Meraki: The Most Common Example
When the CCST exam references cloud-managed networks, it is almost always referring to Cisco Meraki. Meraki is Cisco's cloud-managed networking platform, and it supports a wide range of hardware including wireless access points, switches, security appliances (firewalls), and cameras.
Every Meraki device is managed through the Meraki Dashboard, a web-based portal at dashboard.meraki.com. Once a Meraki device is registered to an organization's account, it reaches out to Meraki's cloud infrastructure and establishes a secure connection. From that point forward, all management traffic flows through the cloud.
Key Features of the Meraki Dashboard
- Centralized visibility: You can see the status, uptime, and performance of every device in your network from one screen.
- Zero-touch provisioning: A new device can be shipped directly to a remote site. When it powers on and connects to the internet, it automatically pulls its configuration from the cloud.
- Real-time alerts: The dashboard notifies administrators when a device goes offline, traffic spikes occur, or a security event is detected.
- Automatic firmware updates: Meraki handles firmware upgrades on a schedule you control, reducing the manual overhead of keeping devices current.
- Built-in troubleshooting tools: Tools like packet capture, cable testing, and live traffic analysis are available directly in the dashboard without needing CLI access.
How Does It Actually Work?
Meraki devices use a concept called the control plane in the cloud. The management and configuration logic lives in Meraki's data centers, but the actual forwarding of user traffic (the data plane) happens locally on the device. This is an important distinction: if a Meraki device temporarily loses its connection to the cloud, it continues forwarding traffic normally. It just cannot receive new configuration changes until connectivity is restored.
This architecture means the cloud handles the hard work of organizing policies, collecting telemetry, and pushing updates, while the physical hardware focuses on what it does best: moving packets quickly.
Why Does This Matter for Troubleshooting?
The CCST exam places cloud-managed networks under the Diagnosing Problems domain for good reason. When something goes wrong on a Meraki network, your first stop is the dashboard. You might check:
- Whether a device shows as online or offline in the dashboard
- The event log for recent changes or error messages
- The clients list to see which devices are connected and their signal strength or link speed
- The uplink status to verify WAN connectivity on a security appliance
This centralized approach means even a junior technician at a help desk can diagnose a remote site issue without needing to be physically present or having deep CLI expertise.
Traditional vs. Cloud-Managed: A Quick Comparison
- Management location: Traditional uses per-device CLI or local GUI; Meraki uses a single cloud dashboard.
- New device setup: Traditional requires manual configuration; Meraki supports zero-touch deployment.
- Visibility: Traditional is siloed per device; Meraki provides a unified view across all sites.
- Troubleshooting: Traditional relies on CLI commands; Meraki provides built-in dashboard tools.
What's Next?
Now that you understand how cloud-managed networks simplify day-to-day network management, the next step is getting comfortable with some of the specific diagnostic tools available in the Meraki Dashboard. In an upcoming post, we will look at how to read Meraki event logs and interpret device status indicators, two skills that directly apply to the CCST Diagnosing Problems domain.