
Advanced Debugging Techniques for Network Issues
This post covers advanced network debugging techniques on Cisco IOS and IOS-XE, with a focus on conditional debugs to safely scope output in production environments. It walks through real-world debug workflows for OSPF, BGP, and IP SLA troubleshooting with actual CLI output. Engineers will learn ho

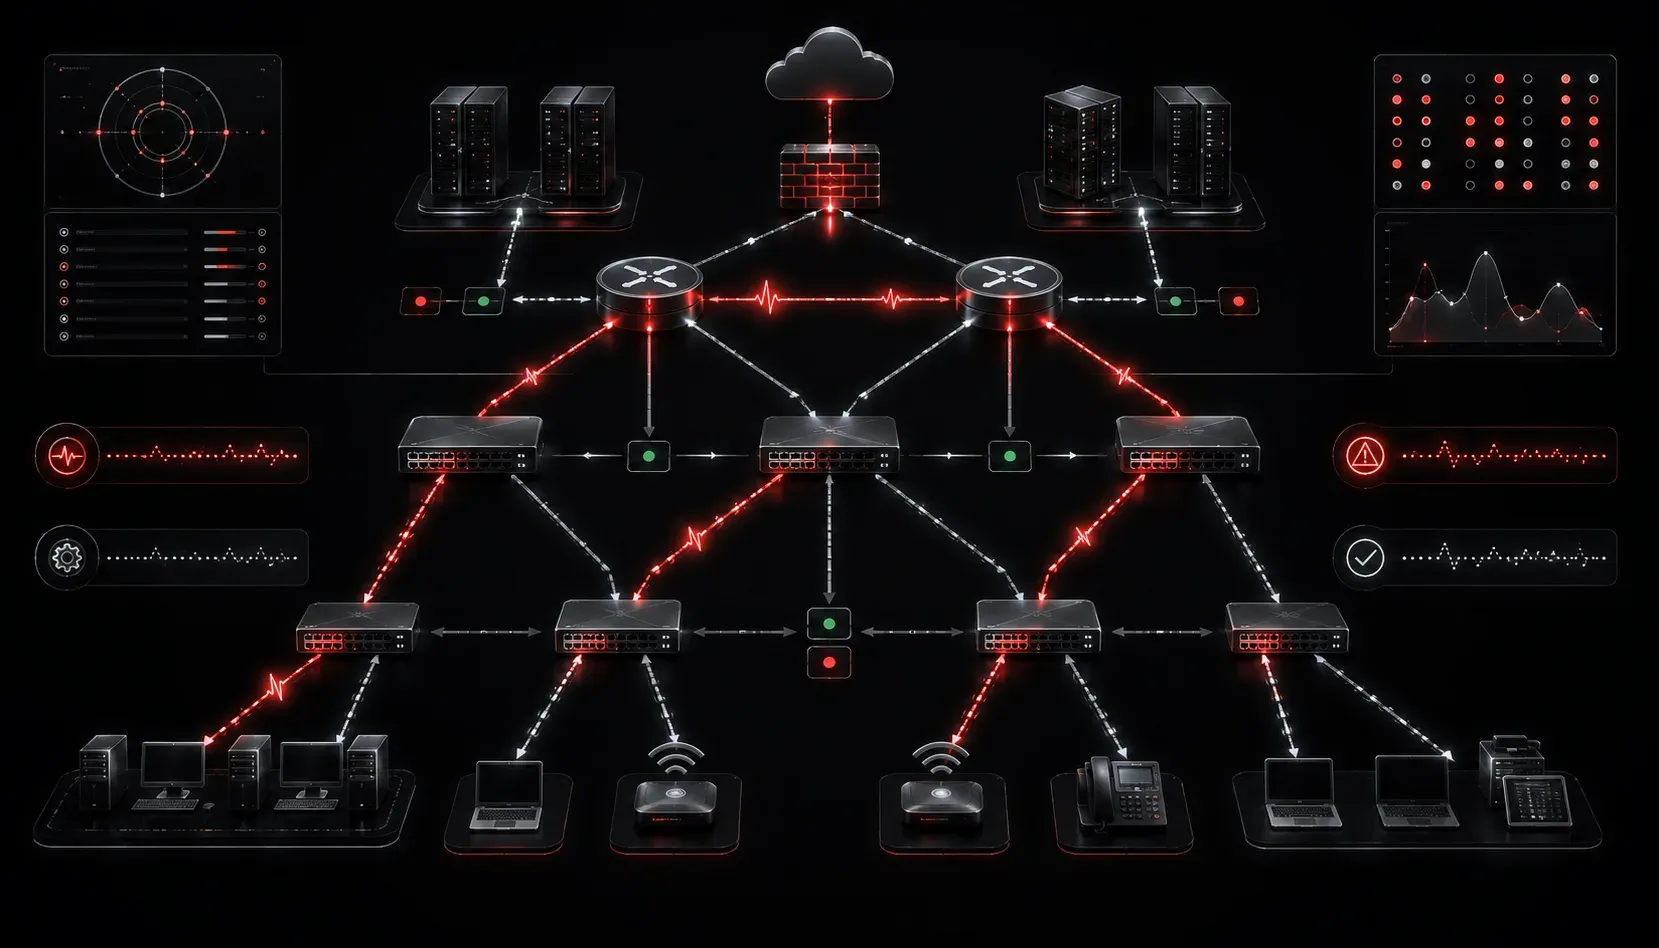
When standard show commands stop giving you answers, debug becomes your scalpel. Used correctly, it exposes protocol-level behavior that no show command can replicate. Used carelessly, it brings down a production router. This post covers how to use Cisco IOS and IOS-XE debug tools safely and precisely, with a focus on conditional debugging for complex enterprise scenarios.
Why Debug Commands Require a Different Mindset
Every engineer knows debug commands carry risk. The reason is not mystical: IOS generates debug output in process-switched context, meaning each debug message consumes CPU cycles. On a busy router handling thousands of BGP prefixes or a high-frequency OSPF adjacency flap, unconstrained debugging can spike CPU to 100% and trigger a reload or packet drops.
Before you type any debug command, establish three things:
- CPU baseline: Check
show processes cpu sortedbefore starting. If you are already above 50% utilization, reconsider your approach. - Console rate limiting: Confirm
logging consoleis appropriate, or redirect to a buffer withlogging buffered 65536 debuggingand useterminal monitorfor remote sessions. - A kill switch: Have
undebug allready. On some platforms, you can schedule it with thedebug timeoutfeature so it self-terminates.
Conditional Debugs: The Right Tool for Production
Conditional debugging lets you scope debug output to a specific interface, IP address, or flow, dramatically reducing CPU impact and output noise. This is the correct method for advanced network debugging in production environments.
Debug Condition by Interface
Use debug condition interface to restrict output to a single interface. This is especially useful when troubleshooting an OSPF adjacency on one link without flooding output from all other neighbors:
R1# debug condition interface GigabitEthernet0/1
Condition 1 set

R1# debug ip ospf adj
OSPF adjacency debugging is on
Only OSPF adjacency events on GigabitEthernet0/1 will generate output. All other interfaces are suppressed.
Debug Condition by IP Address
For BGP or EIGRP issues tied to a specific peer, use debug condition with an IP match:
R1# debug condition ip 10.0.0.2 255.255.255.255
Condition 2 set

R1# debug ip bgp 10.0.0.2 updates
BGP updates debugging is on for neighbor 10.0.0.2
This limits output to packets sourced from or destined to 10.0.0.2. Combined with debug ip bgp updates, you can observe exactly which prefixes are being sent and received without drowning in global BGP update traffic.
Verifying and Clearing Conditions
R1# show debug condition
Condition 1: interface Gi0/1 (1 flags triggered)
Condition 2: ip 10.0.0.2/32 (1 flags triggered)

R1# no debug condition 1
Condition 1 has been deleted

R1# undebug all
All possible debugging has been turned off
Always remove conditions explicitly after use. Orphaned conditions with no associated debug will not cause harm, but they add confusion during future troubleshooting sessions.
Protocol-Specific Debug Workflows
OSPF Adjacency Failures
When an OSPF neighbor is stuck in EXSTART or EXCHANGE, the MTU mismatch is the most common culprit, but the debug confirms it decisively:
R1# debug ip ospf adj
*Jun 10 14:22:13.471: OSPF-1 ADJ   Gi0/1: Rcv DBD from 10.0.0.2 seq 0x1234 opt 0x52 flag 0x7 len 32  mtu 1500 state EXSTART
*Jun 10 14:22:13.471: OSPF-1 ADJ   Gi0/1: Nbr 10.0.0.2: We are not master -- Repeat
The We are not master -- Repeat message in a loop combined with no progression to LOADING state is the MTU mismatch signature. Validate with show interfaces GigabitEthernet0/1 on both sides and compare MTU values.
BGP Route Advertisement Issues
When a prefix is in the routing table but not being advertised to a peer, debug ip bgp updates scoped to the neighbor shows whether the update is being generated and why it may be suppressed:
R1# debug ip bgp 10.0.0.2 updates
BGP(0): 10.0.0.2 NEXT_HOP part 1 next hop 192.168.1.1
BGP(0): 10.0.0.2 send UPDATE (format) 172.16.10.0/24, next 192.168.1.1, metric 0, path 65001
If the update line is absent entirely, suspect a route policy, outbound prefix list, or the network not passing the synchronization check on older IOS.
IP SLA and Tracking Flaps
For floating static route or PBR issues tied to IP SLA, enable both the tracking and ICMP debug together:
R1# debug ip sla trace
R1# debug track
*Jun 10 14:45:01.231: Track: 1 Change #3 ip sla 1, reachability Up->Down
*Jun 10 14:45:01.231: Track: 1 Down change delayed for 10 secs
This output confirms the SLA probe is failing and shows whether your configured delay timers are holding back the route change, which is critical when diagnosing intermittent failover behavior.
Using the Debug Timeout Feature
IOS-XE supports automatic debug termination to protect production systems. Configure it before enabling any debug:
R1(config)# debug timeout 5This kills all active debugs after five minutes automatically. It is a safeguard, not a replacement for discipline. On platforms that do not support debug timeout, use a scheduled EEM applet as a fallback:
R1(config)# event manager applet KILL-DEBUG
R1(config-applet)# event timer countdown time 300
R1(config-applet)# action 1.0 cli command "enable"
R1(config-applet)# action 2.0 cli command "undebug all"
Structured Troubleshooting: Tying It Together
Advanced network debugging is most effective when driven by a hypothesis. Before enabling any debug, form a specific question: "Is R1 sending OSPF hellos on Gi0/1?" or "Is the BGP update for 172.16.10.0/24 being sent to peer 10.0.0.2?" Each debug command should answer one question. If the output confirms your hypothesis, move to the next layer. If it disproves it, revise the hypothesis. This methodology prevents the common mistake of running five debugs simultaneously and being unable to interpret the combined output.
Pair debugs with logging timestamps for correlation. Enable service timestamps debug datetime msec globally so every debug line carries a millisecond timestamp, which allows you to correlate events across devices using a common NTP source.
What's Next
With conditional debugs and structured troubleshooting methodology in place, the next logical step is understanding how to collect and correlate this data at scale using Cisco's built-in network assurance tooling. The next post covers Embedded Event Manager (EEM) scripting for automated fault detection and response, extending your troubleshooting capability beyond manual CLI interaction. If you want to go deeper on the ENCOR exam domains covered here, the Cisco Press CCNP and CCIE Enterprise Core ENCOR 350-401 Official Cert Guide by Brad Edgeworth covers network assurance with the exam-level precision you need.
Tools and resources for this topic
- CCNP ENCOR 350-401 Official Cert Guide — The definitive ENCOR study resource by Brad Edgeworth. Covers enterprise infrastructure, virtualisation, and automation.