
Troubleshooting Common Flexible NetFlow Issues
This post provides a structured troubleshooting methodology for Flexible NetFlow issues in enterprise deployments, covering misconfigured monitors, flow cache problems, export failures, data accuracy issues, and platform-specific hardware offload considerations. Engineers will find actionable CLI c

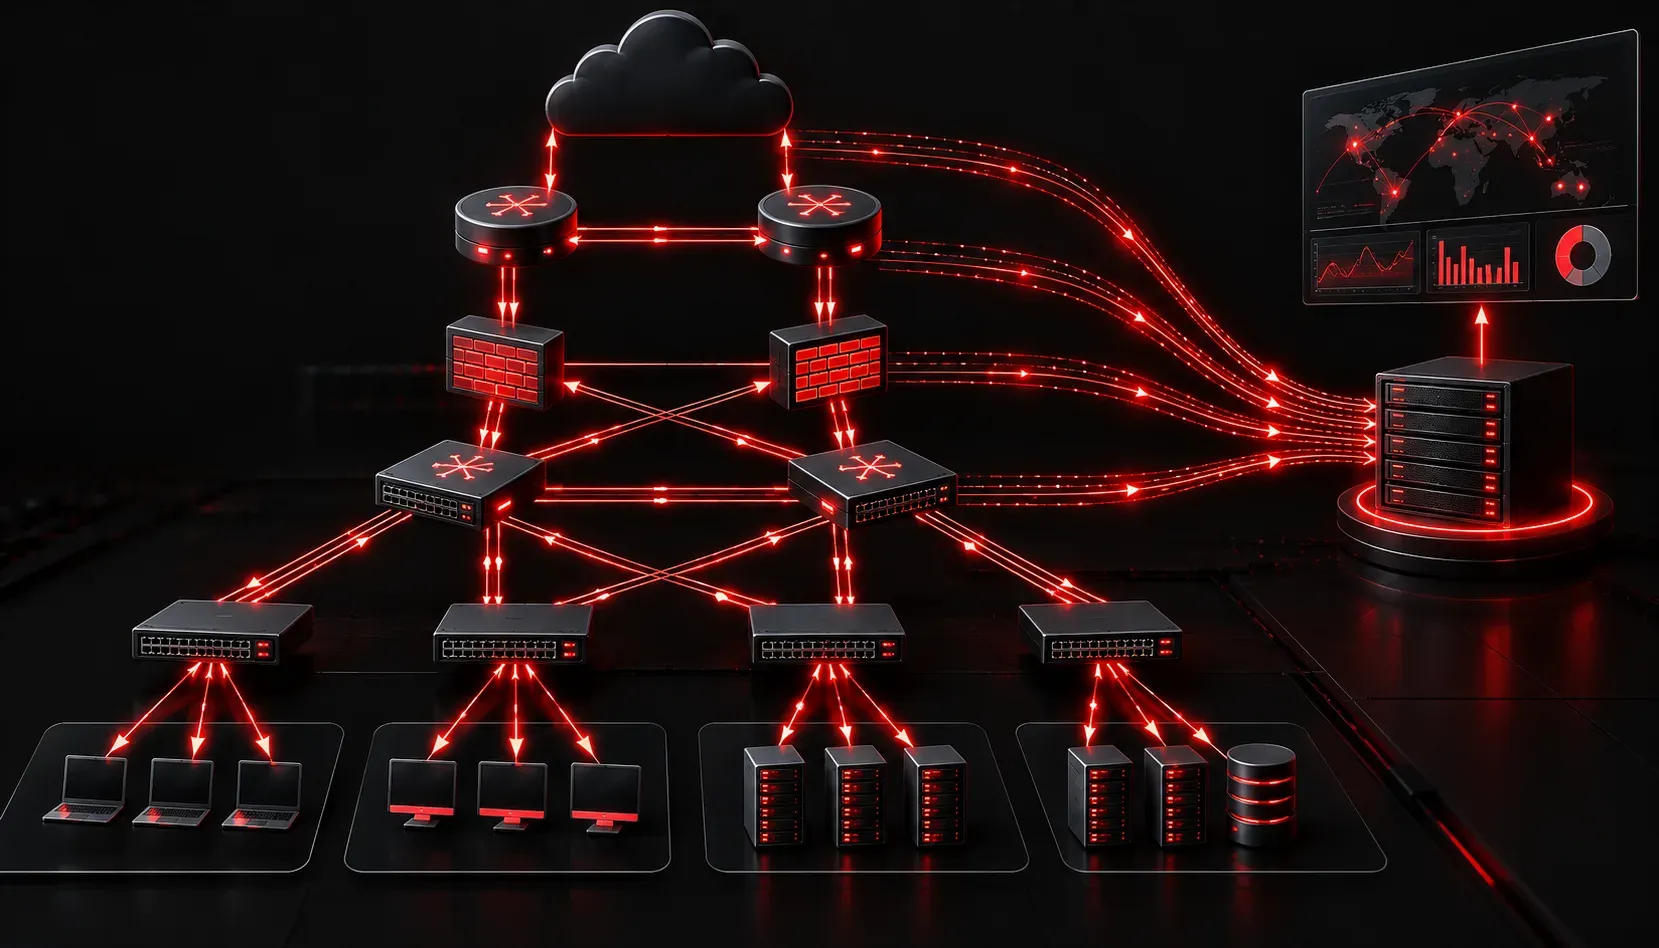
Flexible NetFlow (FNF) is a powerful traffic accounting and visibility tool, but when it misbehaves, the symptoms can be subtle: missing flows, incomplete records, export failures, or silently incorrect data feeding your collector. This post walks through the most common FNF problems encountered in enterprise deployments and gives you a structured methodology to isolate and fix them.
Understanding the FNF Pipeline Before You Troubleshoot
Before chasing a symptom, anchor your mental model to the FNF pipeline: traffic hits an interface, the flow monitor captures it against a flow record definition, matched flows are cached in the flow cache, and the flow exporter periodically ships UDP datagrams to a collector. A failure anywhere in this chain produces different symptoms. The first step in any Flexible NetFlow troubleshooting session is to verify each stage independently.
Verifying the Configuration Chain
The most common root cause for missing data is a misconfigured or unapplied monitor. Run this sequence first:
show flow monitor <monitor-name> statistics
show flow monitor <monitor-name> cache
show flow exporter <exporter-name> statistics
show flow interface <interface-id>
If show flow interface returns nothing for the interface you expect to be monitored, the monitor is not applied. Check that you have both ingress and egress directions configured where required:
interface GigabitEthernet0/1
 ip flow monitor MONITOR-NAME input
 ip flow monitor MONITOR-NAME output
A common oversight is applying the monitor in only one direction and then wondering why asymmetric flows are incomplete. On routed interfaces, ingress monitors capture traffic before routing decisions; egress monitors capture post-route, post-NAT traffic. For NAT environments, applying the monitor on the inside interface in both directions gives you pre-NAT addressing.
Flow Cache Issues: Entries Missing or Stale
If the monitor is applied but show flow monitor cache shows zero or suspiciously low entry counts, investigate cache sizing and timeout values.
flow monitor MONITOR-NAME
 cache entries 16384
 cache timeout active 60
 cache timeout inactive 15
The default cache size is 4096 entries on most platforms. In high-traffic environments, a full cache causes flow drops. Use show flow monitor <name> statistics and look at the Flows dropped (no memory) counter. If that counter is incrementing, increase the cache entries value. The maximum is platform-dependent; validate with show platform resources or equivalent.
Timeout mismatches also affect data accuracy. An active timeout that is too long delays export and can result in flow records that span multiple billing or analysis intervals. An inactive timeout that is too short causes premature export of long-lived flows, splitting what should be a single session into multiple records at the collector.
Export Failures: The Silent Data Black Hole
Export failures are particularly dangerous because the router continues to appear functional while your collector receives nothing. Check exporter statistics:
show flow exporter EXPORTER-NAME statisticsKey counters to inspect:
- Packets sent: Should be incrementing. If it is zero, the exporter is not firing.
- Packets dropped (no FIB): The source IP for the export cannot be routed. Verify the
sourceinterface configuration and that there is a reachable route to the collector. - Packets dropped (other): Usually indicates an ACL or policy blocking the UDP export traffic.
Check the exporter source configuration. Using a Loopback as the source is best practice because it provides stability across physical interface failures:
flow exporter EXPORTER-NAME
 destination 192.168.100.50
 source Loopback0
 transport udp 2055
 export-protocol netflow-v9
If the source interface is a physical interface that bounces, exports will fail during the outage and potentially miss flows. Validate reachability from the device to the collector using ping 192.168.100.50 source Loopback0. If this fails, your export will fail.
Also verify no access list is blocking UDP port 2055 (or whichever port your collector uses) between the router and the NetFlow collector. This is frequently overlooked in environments where the collector sits across a firewall or service policy.
Data Accuracy Problems: The Record Definition
FNF data accuracy problems frequently originate in the flow record definition itself. If your collector is receiving records but fields are missing or zero-valued, the flow record is not capturing those fields.
flow record MY-RECORD
 match ipv4 source address
 match ipv4 destination address
 match transport source-port
 match transport destination-port
 match ip protocol
 match ip tos
 collect counter bytes
 collect counter packets
 collect interface input
 collect timestamp sys-uptime first
 collect timestamp sys-uptime last
Pay attention to the distinction between match and collect fields. Match fields define what makes a flow unique; collect fields are aggregated metrics within that flow. If you need VLAN information, BGP next-hop, or DSCP markings at the collector, they must be explicitly declared as collect fields in the record. FNF does not export anything not defined in the record.
A specific gotcha on Catalyst platforms with hardware-based forwarding: not all collect fields are supported in hardware. Fields that are not hardware-supported force the matching traffic to be processed in software, which has serious performance implications at scale. Always validate platform support for your record fields using the platform documentation or show platform fed active fnf record on applicable IOS-XE platforms.
Platform-Specific Hardware Offload Issues
On Catalyst 9000 series switches running IOS-XE, FNF operates primarily in the ASIC. If a flow record includes fields the ASIC cannot process natively, traffic may be punted to the CPU. Confirm whether hardware offload is active:
show platform software fed switch active fnf flows
show platform software fed switch active fnf statistics
Elevated CPU on a switch running FNF is a strong indicator that your record definition is forcing software-path processing. Simplify the record to hardware-supported fields and verify CPU normalizes.
Sampled NetFlow: When Your Numbers Do Not Add Up
If you are using a sampler to reduce flow volume, verify the sampler configuration is consistent across all interfaces and that your collector applies the correct scaling factor:
sampler MY-SAMPLER
 mode random 1 out-of 100
With a 1-in-100 sampler, the collector must multiply byte and packet counts by 100 to approximate actual traffic volumes. If the collector is receiving the raw values without scaling, every traffic report will show approximately 1% of actual throughput. Verify the collector configuration and confirm it is receiving the sampling interval field in the NetFlow v9 or IPFIX export, which allows it to auto-scale.
Useful Verification and Debug Commands
show flow monitor <name> cache aggregate ipv4 destination address: Quickly summarize top destinations from the cache without a collector.debug flow monitor <name> cache: Use with extreme caution in production; generates significant output.show ip cache flow: Legacy command, but useful on older IOS platforms to confirm traditional NetFlow is active if FNF is misbehaving.show ip flow export: On platforms running both traditional and flexible NetFlow, confirms which export mechanism is active.
What's Next
With FNF working reliably, the next logical area to explore is IP SLA for active network performance monitoring. Where NetFlow tells you what traffic traversed the network, IP SLA lets you proactively measure latency, jitter, and packet loss across specific paths before users report problems. The troubleshooting methodology overlaps significantly: verify the operation is configured correctly, confirm the responder is reachable, and validate the results align with what your monitoring platform reports.
For exam preparation on both FNF and network assurance tools, the Cisco Press CCNP and CCIE Enterprise Core ENCOR 350-401 Official Cert Guide by Brad Edgeworth covers both topics with the depth the exam requires.
Tools and resources for this topic
- CCNP ENCOR 350-401 Official Cert Guide — The definitive ENCOR study resource by Brad Edgeworth. Covers enterprise infrastructure, virtualisation, and automation.