
Viewing Running Processes with ps and top
This post introduces two essential Linux tools for viewing running processes: ps and top. It covers how to use ps aux to get a snapshot of all processes and how to use top for a live, real-time view, including useful keyboard shortcuts for both tools.

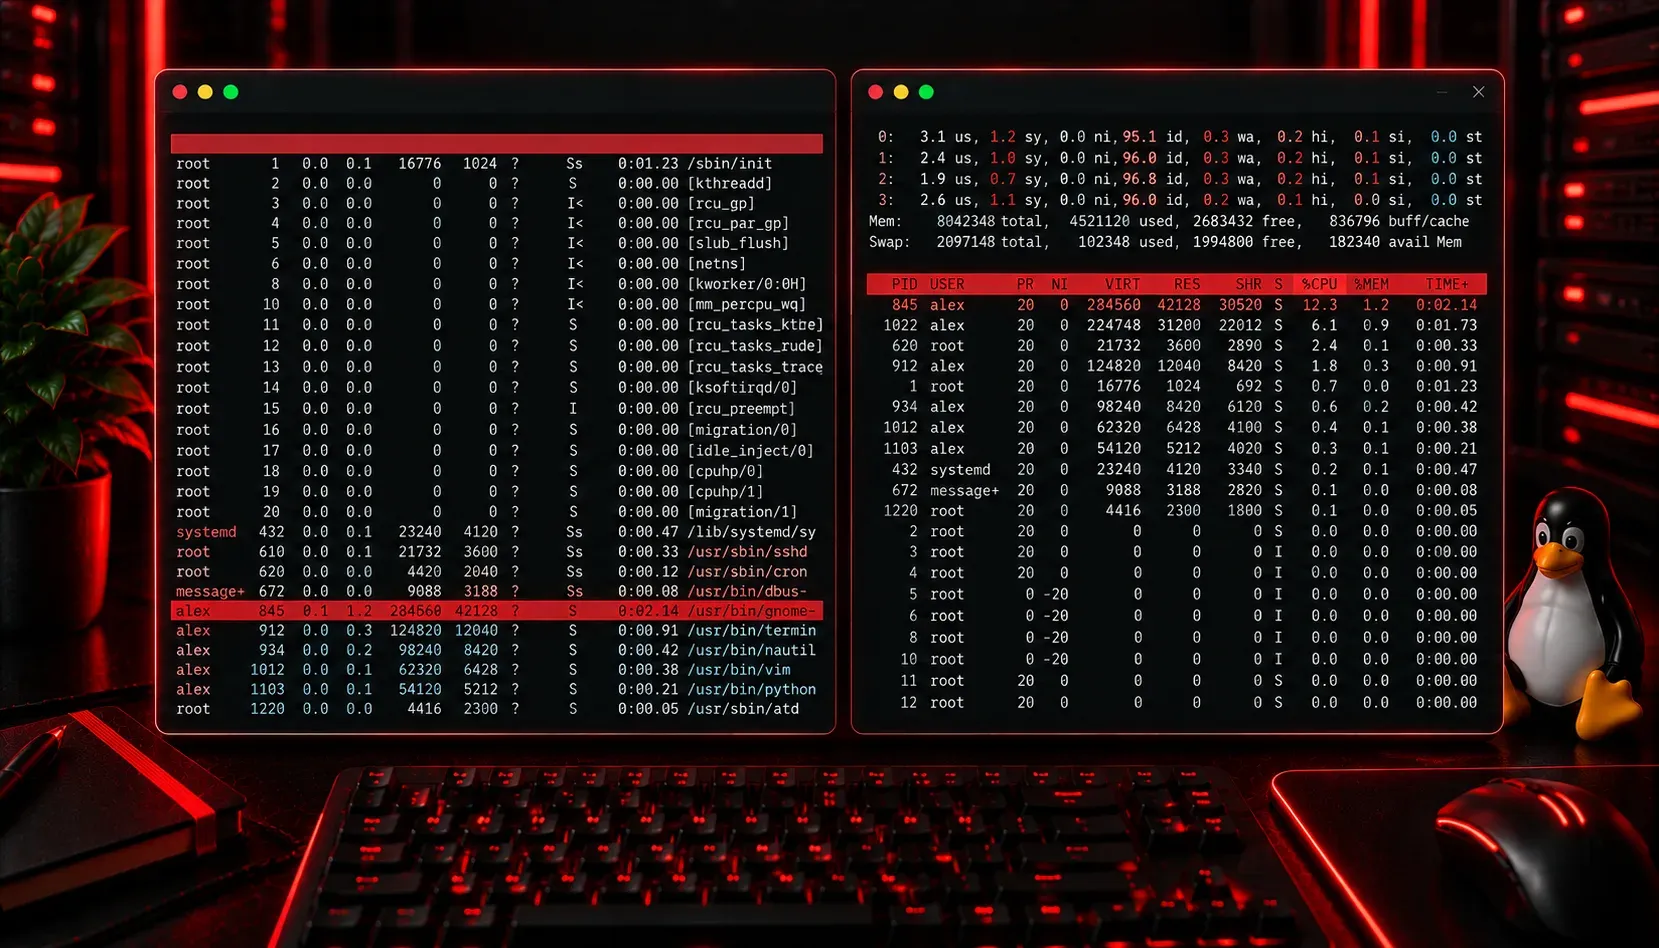
Every program running on your Linux system is a process. When you open a terminal, run a script, or start a web server, Linux creates a process for it and assigns it a unique Process ID (PID). Being able to see what is running on your system is one of the most fundamental skills you will use every day as a Linux user or administrator. Two tools make this easy: ps and top.
The ps Command: A Snapshot of Processes
Think of ps (process status) as a photograph. It captures what is running at the exact moment you run the command. It does not update automatically; it just shows you a still image of the current process list.
Running ps on its own gives you a very limited view, showing only the processes attached to your current terminal session:
$ ps
  PID TTY          TIME CMD
 1042 pts/0    00:00:00 bash
 1089 pts/0    00:00:00 ps
That is not very useful in most situations. The real power comes from adding flags. The most commonly used combination is ps aux:
$ ps aux
USER       PID %CPU %MEM    VSZ   RSS TTY      STAT START   TIME COMMAND
root         1  0.0  0.1  16952  3456 ?        Ss   09:00   0:01 /sbin/init
root       312  0.0  0.2  45312  5120 ?        Ss   09:00   0:00 /lib/systemd/systemd-journald
ahmed     1042  0.0  0.1  24000  4096 pts/0    Ss   09:05   0:00 bash
ahmed     1090  0.0  0.0  12832  1536 pts/0    R+   09:10   0:00 ps aux
Here is what each column means:
- USER: the user who owns the process
- PID: the unique process ID
- %CPU: how much CPU the process is using
- %MEM: how much memory the process is using
- STAT: the process state (S = sleeping, R = running, Z = zombie)
- COMMAND: the command that started the process
You can also search for a specific process by piping ps aux through grep. For example, to find all processes related to Python:
$ ps aux | grep pythonThe top Command: A Live View
If ps is a photograph, top is a live video feed. It refreshes every few seconds and shows you a dynamic, real-time view of your running processes, sorted by CPU usage by default.
$ topThe output looks something like this:
top - 09:15:01 up  1:15,  1 user,  load average: 0.05, 0.10, 0.08
Tasks: 112 total,   1 running, 111 sleeping,   0 stopped,   0 zombie
%Cpu(s):  2.3 us,  0.5 sy,  0.0 ni, 97.0 id,  0.0 wa,  0.0 hi,  0.2 si
MiB Mem :   7854.0 total,   4210.4 free,   2100.6 used,   1543.0 buff/cache

  PID USER      PR  NI    VIRT    RES    SHR S  %CPU  %MEM     TIME+ COMMAND
 1234 ahmed     20   0  512000  32000  12000 R   5.0   0.4   0:03.21 python3
  312 root      20   0   45312   5120   3200 S   0.3   0.1   0:00.45 journald
Useful top Keyboard Shortcuts
While top is running, you can interact with it using keyboard shortcuts:
- q: quit and return to the terminal
- k: kill a process (you will be prompted for the PID)
- M: sort processes by memory usage
- P: sort processes by CPU usage (the default)
- h: open the help screen
ps vs top: Which One Should You Use?
Use ps aux when you want to quickly search for a specific process or capture the process list for logging. Use top when you are troubleshooting performance issues and need to see what is consuming CPU or memory in real time. Both tools are available on virtually every Linux system with no installation required.
What's Next
Now that you can see what is running on your system, the natural next step is learning how to control those processes. In the next post, we will cover how to stop, pause, and manage processes using signals and the kill command, giving you full control over what runs on your Linux machine.