
What is Syslog and How Does It Work in Networking?
This post introduces syslog for CCNA learners, explaining what it is, why it matters for network monitoring, and how Cisco devices use it. It covers syslog severity levels, log destinations, basic IOS configuration commands, and how to read a syslog message.

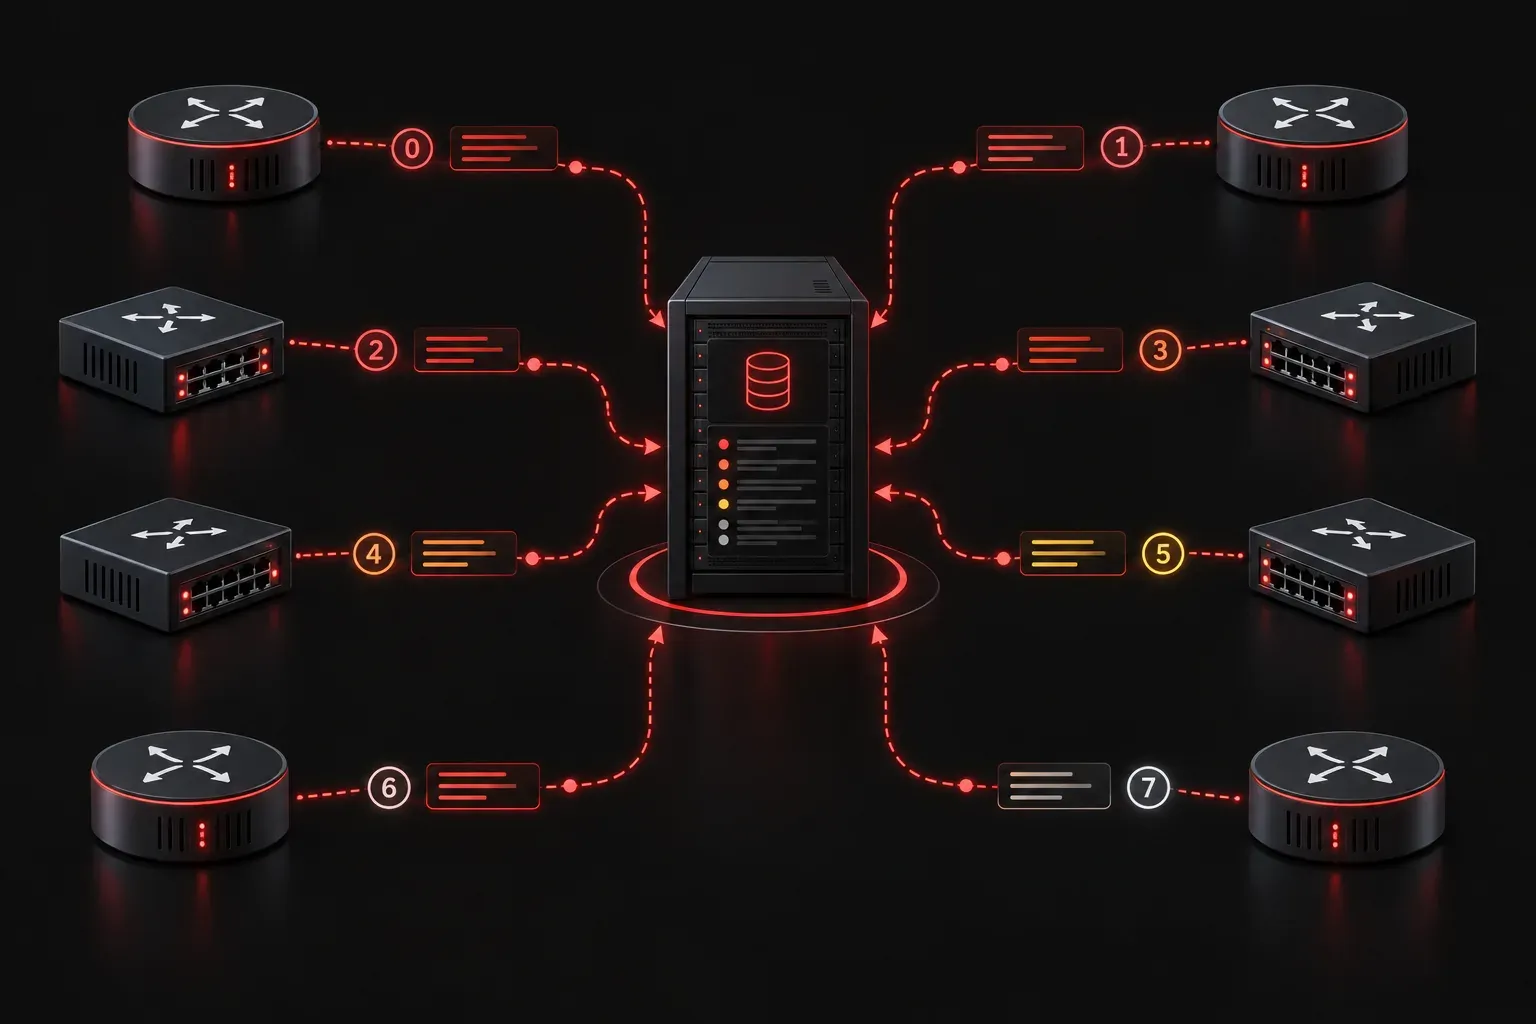
If you have ever wondered how network engineers know when something goes wrong on a device at 3 AM, the answer usually involves syslog. It is one of the most fundamental tools in network monitoring, and it appears on the CCNA exam for good reason. Understanding syslog gives you a window into how Cisco devices communicate what is happening inside them.
What Is Syslog?
Syslog is a standardized protocol used by network devices to send log messages about events, errors, and status changes. The name comes from "system logging," and it has been around since the early days of UNIX systems. In networking, syslog allows routers, switches, firewalls, and other devices to report what they are doing, either to a local buffer, a connected terminal, or a central syslog server.
Think of it like this: your Cisco router is constantly observing its own behavior. When something notable happens, such as an interface going down, a configuration change, or an authentication failure, it generates a log message. Syslog is the mechanism that captures and delivers that message to wherever you need it.
Why Syslog Matters for Network Monitoring
Without syslog, troubleshooting a network issue would mean logging into each device individually and hoping you can piece together what happened. With syslog, all of your devices can send their logs to a single centralized syslog server. This makes it dramatically easier to:
- Detect and diagnose outages quickly
- Identify patterns across multiple devices
- Maintain an audit trail of changes and events
- Meet compliance requirements for log retention
In short, syslog is the foundation of effective network monitoring in any production environment.
Syslog Severity Levels
Not every log message is equally urgent. Syslog defines eight severity levels, numbered 0 through 7, where 0 is the most critical and 7 is the most verbose. You need to know these for the CCNA exam:
- 0 - Emergency: The system is unusable
- 1 - Alert: Immediate action required
- 2 - Critical: Critical conditions
- 3 - Error: Error conditions
- 4 - Warning: Warning conditions
- 5 - Notice: Normal but significant conditions
- 6 - Informational: Informational messages
- 7 - Debug: Debug-level messages
A helpful memory trick is the phrase: "Every Awesome Cisco Engineer Will Need Daily Inspiration" (Emergency, Alert, Critical, Error, Warning, Notice, Debug, Informational). Some people reorder the last two, so just make sure you know that 6 is informational and 7 is debug.
Where Syslog Messages Go on a Cisco Device
On a Cisco router or switch, log messages can be sent to several destinations. You control this through configuration:
- Console line: Messages appear on the console port session
- VTY lines: Messages appear during a Telnet or SSH session (requires the
terminal monitorcommand) - Logging buffer: Messages are stored in RAM on the device itself
- Syslog server: Messages are forwarded over the network to a central logging host
Here is a basic example of what syslog configuration looks like on a Cisco IOS device:
Router(config)# logging 192.168.1.100
Router(config)# logging trap warnings
Router(config)# logging buffered 16384
Router(config)# service timestamps log datetime msec
In this example, 192.168.1.100 is the IP address of the syslog server. The logging trap warnings command tells the router to send messages at severity level 4 (Warning) and above to that server. The service timestamps log datetime msec command adds a timestamp to each log entry, which is critical for correlating events across devices.
What a Syslog Message Looks Like
Understanding the format of a syslog message helps you read them quickly during troubleshooting. Here is a typical example from a Cisco device:
*Mar 1 00:12:43.456: %LINK-3-UPDOWN: Interface GigabitEthernet0/1, changed state to downBreaking this down:
- Timestamp:
*Mar 1 00:12:43.456 - Facility:
LINK(the part of the system reporting the event) - Severity:
3(Error level) - Mnemonic:
UPDOWN(short description of the event type) - Message text: The human-readable explanation
What's Next
Now that you understand what syslog is and how it works, the natural next step is understanding how to configure it in more detail and how it compares to other network management protocols like SNMP and NetFlow. Those tools all complement syslog to give you a complete picture of your network's health. We will cover SNMP next, including how it differs from syslog and when you would use each one.
For deeper reading on syslog and all IP Services topics, check out the Cisco Press CCNA 200-301 Official Cert Guide by Wendell Odom. It covers this exam objective thoroughly and is the most reliable resource for CCNA preparation.
Tools and resources for this topic
- Wendell Odom CCNA Vol 1 — Covers networking fundamentals, switching, and routing basics.
- Wendell Odom CCNA Vol 2 — Covers advanced routing, WAN, infrastructure services, and security.