
How Do Network Monitoring Tools Work?
Network monitoring tools function like security cameras for networks, continuously collecting data through protocols like SNMP, analyzing traffic patterns, and alerting administrators to problems. The monitoring process involves data collection, analysis, alerting, and reporting to maintain network

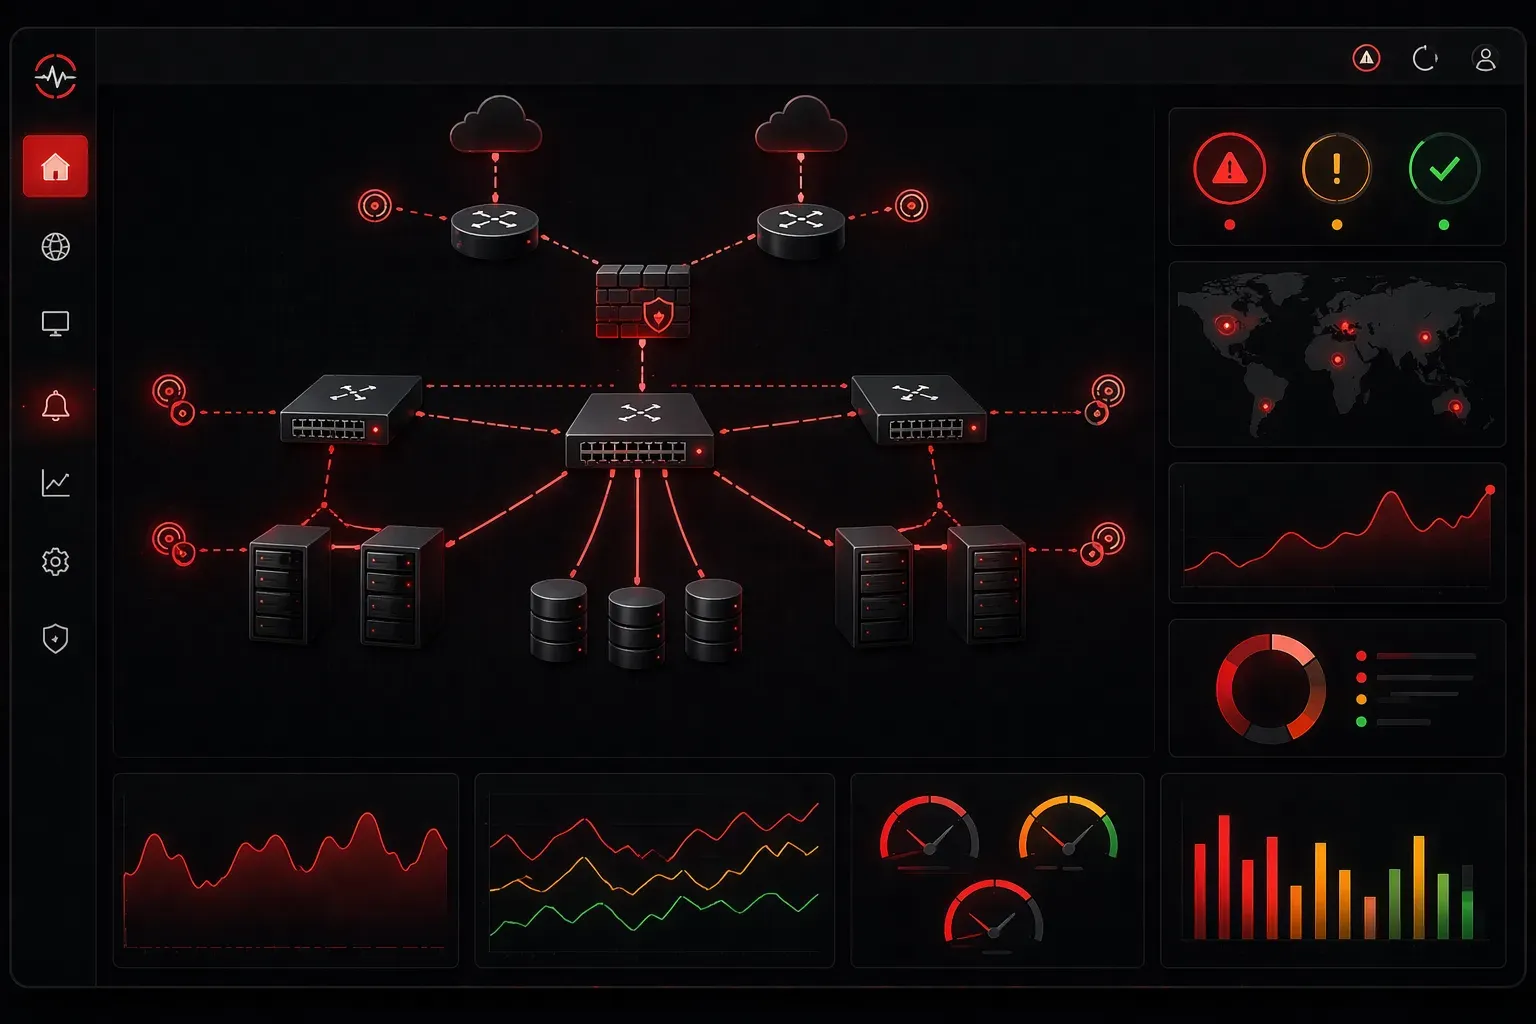
Network monitoring tools are like security cameras for your network infrastructure. Just as security cameras watch for unusual activity in a building, network monitoring tools continuously observe your network to detect problems, track performance, and ensure everything runs smoothly.
The Basic Monitoring Process
Understanding how tools work starts with grasping the fundamental monitoring process. Think of it like a doctor taking your vital signs during a checkup. The tool collects data points (like heart rate and blood pressure), compares them to normal ranges, and alerts medical staff if something looks concerning.
Network monitoring follows a similar pattern:
- Data Collection: Tools gather information about network devices and traffic
- Analysis: The collected data is compared against baselines and thresholds
- Alerting: When problems are detected, administrators receive notifications
- Reporting: Historical data is compiled into reports for trend analysis
How SNMP-Based Tools Work
Simple Network Management Protocol (SNMP) is a foundation for many network tools, though it's not the only protocol used for network monitoring. Other important protocols include NetFlow (Network Flow protocol for traffic analysis), sFlow (sampled Flow for network monitoring), and WMI (Windows Management Instrumentation for Windows systems).
Here's how an SNMP monitoring tool operates:
1. Tool sends SNMP GET request to device (192.168.1.1)
2. Device responds with requested data (CPU: 45%, Memory: 62%)
3. Tool stores this data in its database
4. Process repeats every few minutes
The tool asks questions like "What's your CPU usage?" or "How many bytes have passed through interface 1?" The device responds with specific numbers that the monitoring system can track over time. Popular SNMP-based tools include Nagios, Zabbix, and PRTG Network Monitor.
Traffic Analysis Tools
Some network monitoring tools work by examining the actual data flowing through your network, similar to how a postal inspector might sample packages to understand mail patterns.
These tools use different approaches:
- Packet Capture: Tools like Wireshark copy and analyze individual network packets
- Flow Monitoring: NetFlow-enabled devices send traffic summaries to collectors
- Port Mirroring: Network switches copy traffic to a monitoring port for analysis
For example, a flow-based tool might receive data showing that 500MB of HTTP traffic flowed from 192.168.1.100 to 10.0.0.50 between 2:00 PM and 2:15 PM.
Synthetic Monitoring
This monitoring process works like having a robot customer test your services continuously. The tool generates artificial traffic to test if services are working properly. This approach differs from real user monitoring (RUM), which tracks actual user interactions and experiences with your applications and services.
A synthetic monitoring tool might:
ping google.com every 30 seconds
HTTP GET request to company website every 5 minutes
DNS lookup test for mail.company.com every 2 minutes
If any test fails, the tool immediately knows there's a problem, often before real users notice. While synthetic monitoring provides proactive testing with predictable conditions, real user monitoring captures actual user behavior and performance variations across different devices and locations.
Agent-Based vs. Agentless Monitoring
Think of this like the difference between having a security guard stationed in each building (agent-based) versus using remote cameras to monitor multiple buildings from a central location (agentless).
Agent-based tools install small software programs on each device being monitored. These agents collect detailed local information and send it back to the central monitoring system.
Agentless tools monitor devices remotely using protocols like SNMP, NetFlow, or WMI (Windows Management Instrumentation), requiring no software installation on the target devices.
Real-Time vs. Historical Analysis
Modern network monitoring tools provide both immediate alerts and long-term trend analysis. Real-time monitoring catches problems as they happen, while historical analysis helps identify patterns and plan for future capacity needs.
For instance, you might receive an immediate alert when server CPU hits 90%, but historical graphs might show that CPU usage has been gradually increasing over the past month, indicating you need to plan for hardware upgrades.
What's Next
Now that you understand how network monitoring tools function, the next step is learning about specific monitoring protocols like SNMP, NetFlow, and WMI in greater detail. These protocols are the communication languages that make network monitoring possible, and understanding them will deepen your knowledge of network operations.
Tools and resources for this topic
- CompTIA Network+ Study Guide — Comprehensive N10-009 exam preparation covering all five domains.