
Troubleshooting SD-Access Control and Data Plane Issues
This post provides a structured, layered approach to troubleshooting SD-Access control and data plane issues. It covers LISP control plane validation, VXLAN data plane verification, SGT policy troubleshooting, and how to use DNA Center Assurance as a diagnostic tool. Designed for experienced engine

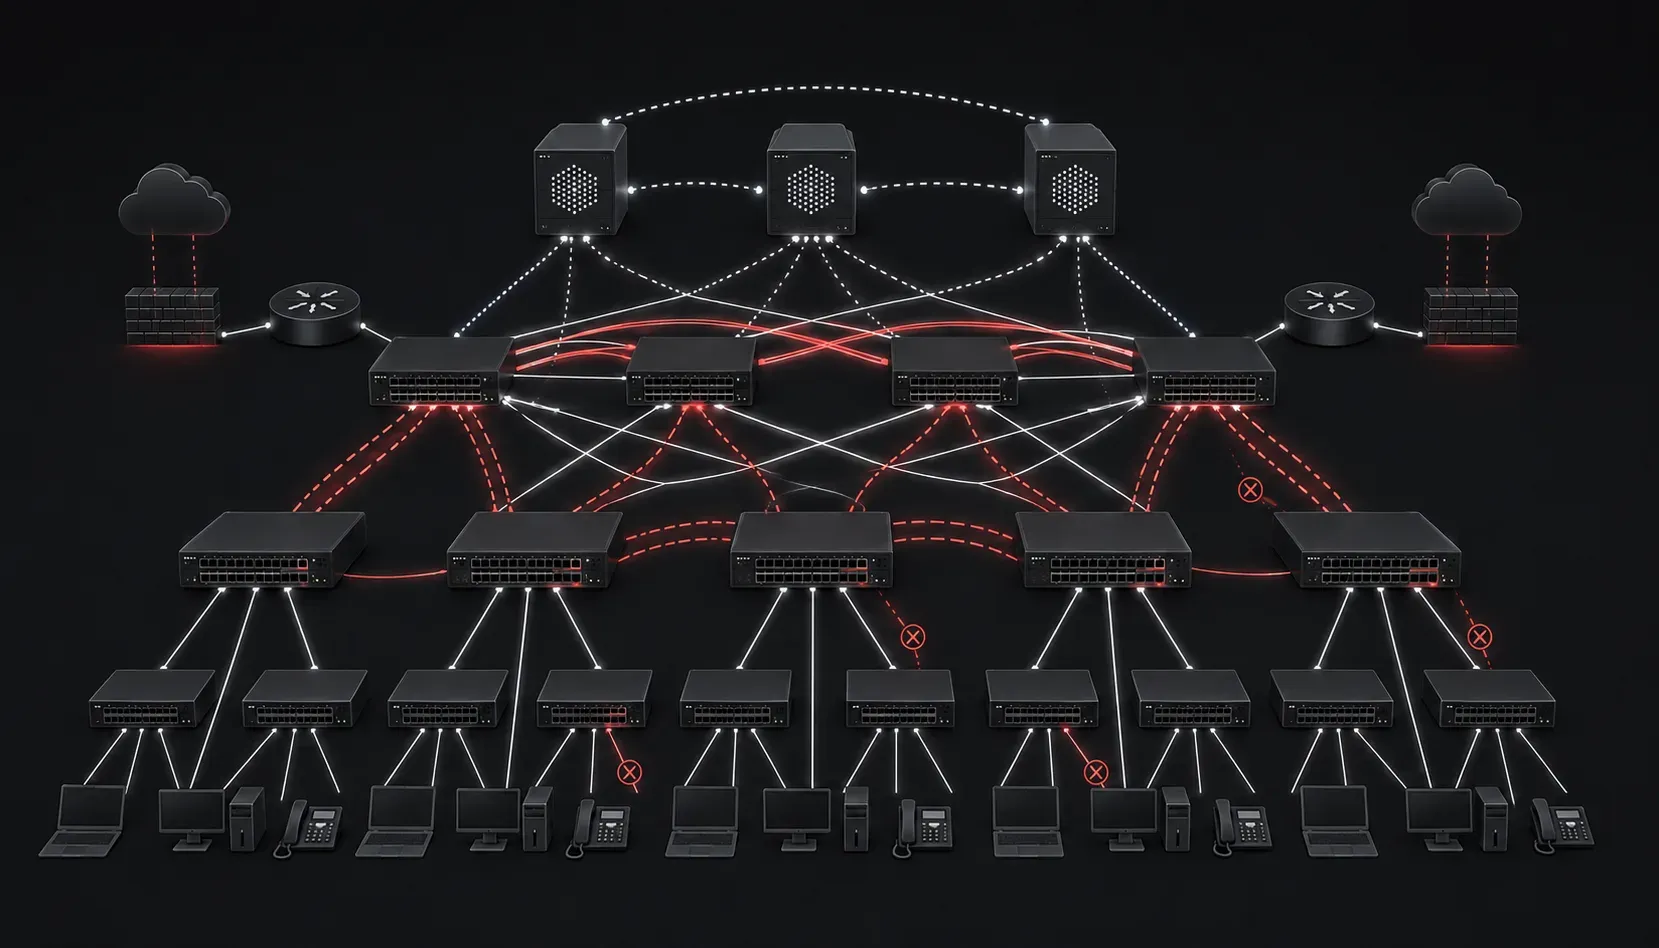
SD-Access Plane Architecture: A Troubleshooting Foundation
Before diving into fault isolation, it helps to frame where problems actually live in an SD-Access fabric. The control plane relies on LISP (Locator/ID Separation Protocol) as its core protocol, handling endpoint registration and map-resolution between ITRs and ETRs through the Map-Server/Map-Resolver (MS/MR) running on the Control Plane Node (CPN). The data plane is VXLAN, encapsulating traffic between fabric edge nodes. The policy plane rides on top using Cisco TrustSec SGTs. When something breaks, it almost always traces back to one of these three layers, or to the underlay that supports them all.
Troubleshooting SD-Access planes requires a structured, layered approach. Start at the underlay, validate the control plane, then confirm data plane forwarding before touching policy. Skipping layers is the fastest way to chase symptoms instead of root causes.
Underlay Validation First
Every SD-Access fabric issue starts with the underlay. LISP and VXLAN both depend on IP reachability between fabric nodes. If the underlay is broken, the control plane will appear to be the problem.
Verify IS-IS adjacencies on fabric nodes:
show isis neighbors
show isis database
show ip route isis
Confirm that loopback addresses (used for VXLAN VTEP sourcing) are reachable across all fabric nodes. A missing loopback route is a common culprit after a link failure or node replacement. Also check MTU. VXLAN encapsulation adds overhead that varies by implementation, typically around 50 bytes for a standard IPv4 underlay (8-byte VXLAN header, 8-byte UDP header, 20-byte outer IP header, and 14-byte outer Ethernet header), but this can differ depending on whether IPv6 is used in the underlay or additional options are present. If your underlay MTU is set to 1500, large frames will silently drop. The recommended underlay MTU is 9100 or greater in most DNA Center deployments.
show interfaces GigabitEthernet1/0/1 | include MTU
ping 192.168.1.1 repeat 100 size 1572 df-bit
A failed ping with df-bit set at the VXLAN frame size immediately confirms an MTU issue.
Troubleshooting the LISP Control Plane
Control plane issues in SD-Access manifest as endpoints not being reachable, traffic being black-holed after a move, or intermittent connectivity that correlates with endpoint mobility. These point directly to LISP map registration failures or stale cache entries.
Verify Endpoint Registration
On the Control Plane Node (typically a Catalyst 9000 or a dedicated device), confirm that endpoints are actively registered:
show lisp instance-id 4098 ipv4 server registration-history
show lisp instance-id 4098 ipv4 server eid-table
If an endpoint is missing from the EID table, the edge node hasn't registered it. Check whether the fabric edge sees the endpoint at all:
show lisp instance-id 4098 ipv4 database
show lisp session
A missing or down LISP session between the edge node and the CPN is a definitive control plane issue. Check for UDP port 4342 reachability and confirm the fabric edge is configured to point to the correct CPN address.
Map Cache and Stale Entries
After an endpoint moves (wireless roaming, VM migration, port flap), stale map-cache entries on the ITR can cause traffic to forward to the wrong edge node. The cache TTL is typically 24 hours by default. During that window, traffic can black-hole.
show lisp instance-id 4098 ipv4 map-cache
clear lisp instance-id 4098 ipv4 map-cache
Clearing the map-cache forces a fresh map-request/reply cycle. In production, only clear cache for the specific EID prefix in question rather than flushing the entire table. Also verify that SMR (Solicit-Map-Request) messages are enabled, which triggers proactive cache updates when endpoint registration changes:
show lisp instance-id 4098 ipv4 server statistics | include SMRLISP Multicast and Underlay Replication
SD-Access uses either multicast or ingress replication (head-end replication) for BUM traffic. If multicast is configured in the underlay and the multicast tree is broken, BUM flooding fails silently. Verify the multicast underlay with:
show ip mroute
show lisp instance-id 4098 ipv4 publication
Troubleshooting the VXLAN Data Plane
Data plane problems in SD-Access typically present as traffic drops between endpoints that are registered correctly in LISP. The control plane shows the route, but packets don't arrive. This points to VXLAN encapsulation, VTEP misconfiguration, or policy enforcement (SGT) issues.
Verify VXLAN Encapsulation
Confirm that the fabric edge nodes have the correct VTEP configuration and that NVE interfaces are up:
show nve peers
show nve interface nve1 detail
show vxlan vtep
The show nve peers output should list all remote VTEPs with a state of UP. A peer stuck in INIT or missing entirely indicates an underlay reachability issue back to that specific edge node. Cross-reference against the LISP map-cache to confirm the RLOC (Routing Locator) matches the VTEP IP of the remote edge.
Fabric Edge Forwarding Table
On the ingress fabric edge, verify that the destination EID maps to the correct RLOC and VNID:
show lisp instance-id 4098 ipv4 map-cache 192.168.10.50
show mac address-table vlan 1024
If the map-cache entry exists with the correct RLOC, but traffic still fails, use an embedded packet capture or EPC on the egress edge to confirm VXLAN-encapsulated traffic is arriving:
monitor capture CAP interface GigabitEthernet1/0/1 both
monitor capture CAP match ipv4 any any
monitor capture CAP start
show monitor capture CAP buffer brief
SGT Policy Dropping Traffic
If endpoints can ping each other intermittently or only certain traffic flows fail, SGT policy is often the culprit. Verify SGT assignment and SGACL enforcement on the fabric edge:
show cts role-based sgt-map all
show cts role-based counters
show cts role-based permissions
Increment counters in show cts role-based counters confirm active policy enforcement. If the drop counters are climbing, pull the specific SGACL applied between the source and destination SGT pair and verify the policy intent in DNA Center matches what's been downloaded to the device.
DNA Center as a Diagnostic Layer
DNA Center's Assurance feature is a legitimate troubleshooting tool, not just a dashboard. Use the Client 360 view to trace endpoint onboarding events, LISP registration timestamps, and fabric path information. The Path Trace tool visualizes the actual forwarding path through the fabric and can identify where drops are occurring at the device level without requiring CLI access to every node.
For control plane issues, DNA Center's Issues page will surface LISP registration failures and map-cache anomalies with correlated timestamps. This is especially useful in large fabrics where manually polling every CPN is impractical.
Structured Troubleshooting Summary
- Validate underlay IP reachability and MTU between all fabric nodes.
- Confirm IS-IS adjacencies and loopback route propagation.
- Verify LISP sessions between fabric edge and CPN are established.
- Check EID registration on the CPN for the affected endpoint.
- Inspect ITR map-cache for correct RLOC mapping; clear stale entries if needed.
- Confirm NVE peer state and VXLAN encapsulation on the egress path.
- Review SGT assignments and SGACL counters for policy-driven drops.
- Use DNA Center Assurance and Path Trace for correlated, fabric-wide visibility.
What's Next
With SD-Access control and data plane troubleshooting covered, the next logical area is SD-WAN, specifically how the vSmart controller manages OMP (Overlay Management Protocol) and how policy is distributed across the WAN fabric. Understanding how SD-WAN control plane failures differ from SD-Access gives you a complete picture of Cisco's intent-based networking architecture across both the campus and WAN domains.
For deep reference on SD-Access architecture and exam-level detail, the Cisco Press CCNP and CCIE Enterprise Core ENCOR 350-401 Official Cert Guide by Brad Edgeworth covers both the LISP and VXLAN components in the context of exam objectives.
Tools and resources for this topic
- CCNP ENCOR 350-401 Official Cert Guide: The definitive ENCOR study resource by Brad Edgeworth. Covers enterprise infrastructure, virtualisation, and automation.