
Leveraging SNMP and Syslog for Proactive Network Monitoring
This post covers enterprise-grade SNMP and syslog configuration for proactive network monitoring, including SNMPv3 setup, trap vs. inform behavior, syslog severity filtering, and correlation strategies. It targets CCNP ENCOR exam domain 4.1 with real CLI examples and production-ready guidance.

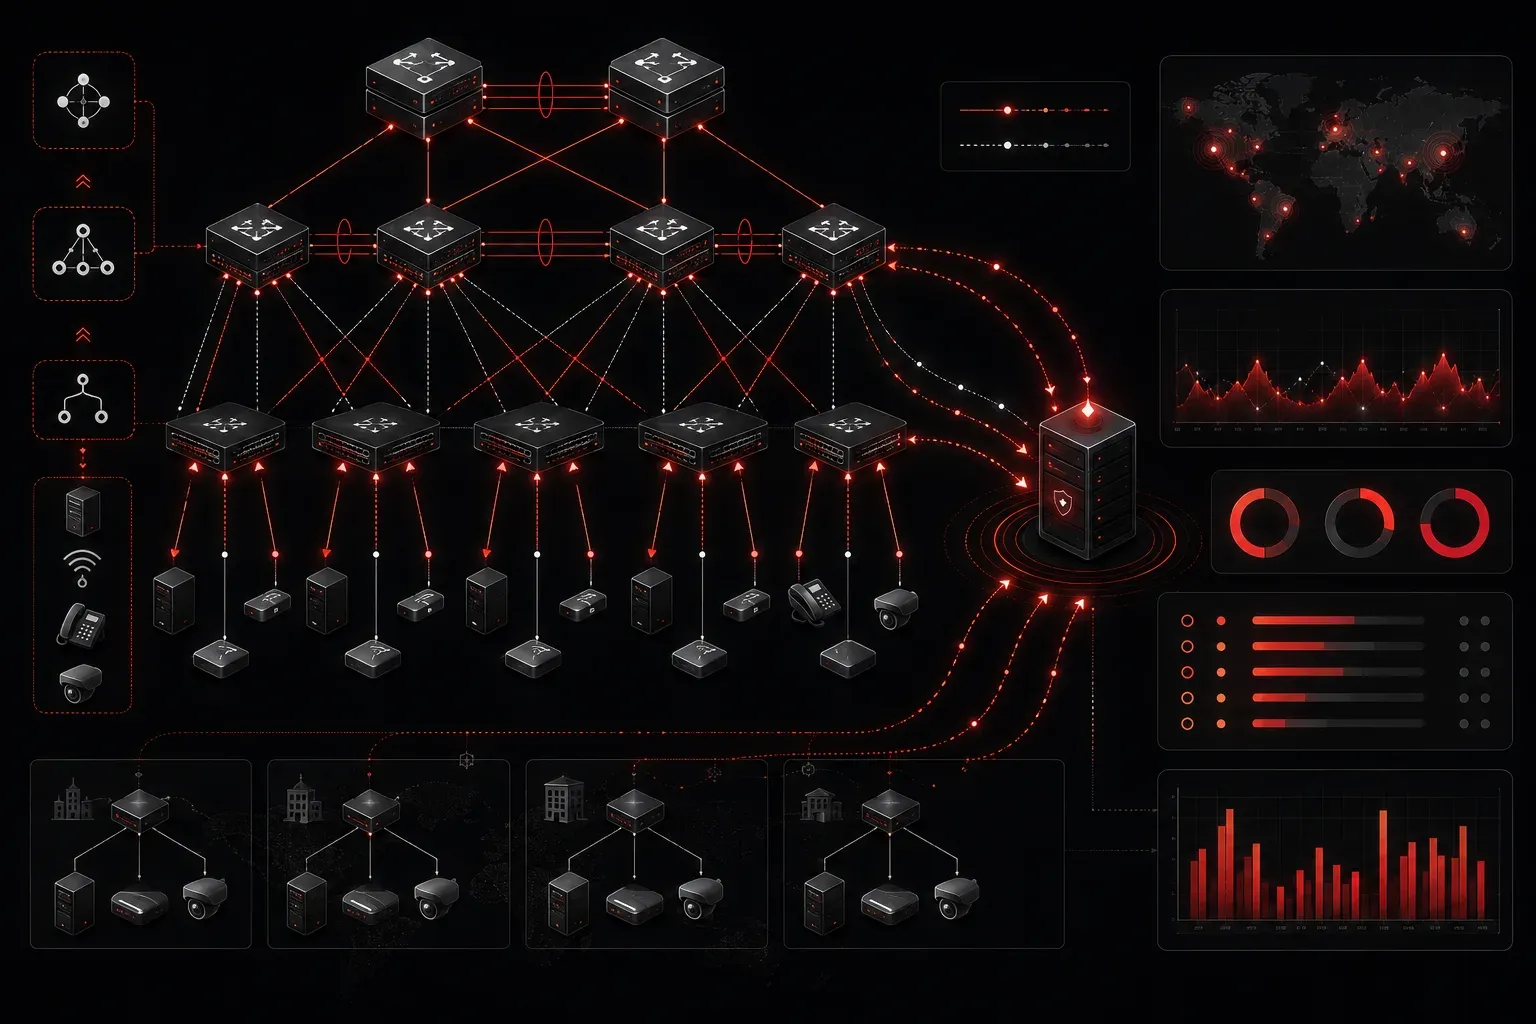
Network monitoring isn't reactive work for engineers who know what they're doing. By the time a user reports an issue, you've already lost ground. SNMP and syslog, configured correctly and analyzed systematically, give you the telemetry to detect problems before they become outages. This post breaks down enterprise-grade configuration of both protocols, with real CLI examples and the troubleshooting logic you need for both production environments and the ENCOR exam.
SNMP: More Than Just Polling
Most engineers understand SNMP polling at a surface level: NMS sends a GET, device responds with OID data. The real value in enterprise environments comes from combining polling with traps and informs, and from understanding which version you're running and why it matters.
SNMPv3 Configuration: The Only Version You Should Be Deploying
SNMPv2c uses community strings sent in cleartext. That's a hard no in any regulated or security-conscious environment. SNMPv3 provides authentication and encryption via users and groups. Here's a complete SNMPv3 configuration for an IOS-XE device:
! Create an ACL to restrict SNMP access
ip access-list standard SNMP-MANAGERS
 permit 10.10.1.20
 permit 10.10.1.21

! Define the SNMP view (what OIDs are accessible)
snmp-server view FULL-VIEW iso included

! Create the group with auth and priv enabled, apply ACL
snmp-server group ENCOR-GROUP v3 priv read FULL-VIEW access SNMP-MANAGERS

! Create the user, assign to group
snmp-server user ENCOR-USER ENCOR-GROUP v3 auth sha AuthP@ssw0rd priv aes 128 PrivP@ssw0rd
Verify the configuration with:
show snmp user
show snmp group
show snmp view
A common exam trap: SNMP users are not displayed in the running config. They exist in a separate database. Always use show snmp user to confirm.
SNMP Traps vs. Informs
Traps are fire-and-forget UDP notifications. Informs are acknowledged by the NMS. For proactive detection in environments where reliability matters, informs are the better choice at the cost of slightly more overhead:
! Configure trap destination (v2c shown for comparison)
snmp-server host 10.10.1.20 version 2c COMMUNITY-STRING

! Configure informs with SNMPv3
snmp-server host 10.10.1.20 informs version 3 priv ENCOR-USER

! Enable specific traps
snmp-server enable traps bgp
snmp-server enable traps ospf
snmp-server enable traps envmon temperature
snmp-server enable traps interface
For proactive detection, focus your trap categories on state changes: interface up/down, routing protocol adjacency changes, CPU threshold crossings, and hardware environment events. Flooding your NMS with every available trap defeats the purpose.
SNMP Polling Best Practices
MIB selection matters. For ENCOR-relevant monitoring, these OIDs are foundational:
- ifOperStatus (IF-MIB): interface operational state
- bgpPeerState (BGP4-MIB): BGP neighbor state
- cpmCPUTotal5min (CISCO-PROCESS-MIB): 5-minute CPU average
- ciscoMemoryPoolUsed (CISCO-MEMORY-POOL-MIB): memory utilization
- entPhySensorValue (ENTITY-SENSOR-MIB): temperature and power readings
Poll frequency should be tuned per metric type. Interface counters every 60 seconds is reasonable. CPU and memory every 5 minutes. Environmental sensors every 10-15 minutes. Over-polling degrades device performance; under-polling creates blind spots.
Syslog: Structured Event Visibility
Syslog is your real-time event feed. The challenge isn't collecting messages; it's collecting the right ones, at the right severity level, with timestamps that are actually useful.
Syslog Configuration on IOS-XE
! Set the logging source interface (important for multi-homed devices)
logging source-interface Loopback0

! Configure the syslog server
logging host 10.10.1.50 transport udp port 514

! Set the logging level (informational = severity 0-6)
logging trap informational

! Ensure timestamps are meaningful
service timestamps log datetime msec localtime show-timezone year

! Buffer configuration for local logging
logging buffered 64000 debugging

! Disable console logging in production (performance impact)
no logging console

! Rate-limit to prevent log storms
logging rate-limit 100 except warnings
The service timestamps command is more important than it looks. Without msec and localtime, correlating events across devices becomes guesswork. Make sure NTP is synchronized before trusting any syslog timestamps:
show ntp status
show clock detail
Syslog Severity Levels: Know Where to Set the Threshold
Setting everything to debugging is not a monitoring strategy. Here's the practical breakdown for production use:
- Severity 0 (emergencies): system unusable
- Severity 1 (alerts): immediate action required
- Severity 2 (critical): critical conditions
- Severity 3 (errors): error conditions, protocol adjacency resets
- Severity 4 (warnings): warning conditions, STP topology changes
- Severity 5 (notifications): normal but significant events, line protocol changes
- Severity 6 (informational): informational messages, configuration changes
- Severity 7 (debugging): debug output only, never to production syslog servers
For enterprise production environments, logging trap informational (severity 0-6) is the standard baseline. Adjust per device role: core routers warrant more verbose logging than access switches.
Syslog Facility Codes and Log Parsing
IOS syslog messages follow a predictable format that your SIEM or log management platform can parse:
%FACILITY-SEVERITY-MNEMONIC: message text

Example:
%OSPF-5-ADJCHG: Process 1, Nbr 10.0.0.2 on GigabitEthernet0/1 from LOADING to FULL, Loading Done
%BGP-5-ADJCHANGE: neighbor 192.168.1.1 Up
%LINEPROTO-5-UPDOWN: Line protocol on Interface GigabitEthernet0/2, changed state to down
Those mnemonics are your key to writing precise alerts. A %LINEPROTO-5-UPDOWN event with "changed state to down" on an uplink interface warrants an immediate page. The same event on an edge port at 2 AM is probably just a workstation going home. Context filtering in your log management platform is where proactive detection actually happens.
Combining SNMP and Syslog for Proactive Detection
The real power comes from correlation. An interface that generates %LINEPROTO-5-UPDOWN events intermittently but shows ifOperStatus = up during the polling interval is a flapping interface your NMS will miss. Syslog catches the events; SNMP captures the steady-state. You need both.
A practical correlation workflow:
- Syslog alert fires on
%OSPF-5-ADJCHGneighbor drop - NMS correlates with SNMP poll showing increased CPU on the same device
- Check
show processes cpu sortedandshow ip ospf statistics - Identify whether the adjacency loss is causing SPF recalculations and impacting CPU
Verify your syslog and SNMP configuration is working end-to-end:
show logging
show snmp
debug snmp packets   ! Use briefly, then no debug all
What's Next
With SNMP and syslog providing your real-time and historical telemetry, the next layer to explore is IP SLA and Netflow, which give you active performance measurement and traffic visibility that passive monitoring can't provide. Those tools complete the Network Assurance picture for ENCOR exam domain 4.1 and round out a production-grade monitoring strategy.
For deeper coverage of these topics alongside the full ENCOR blueprint, the Cisco Press CCNP and CCIE Enterprise Core ENCOR 350-401 Official Cert Guide by Brad Edgeworth is the authoritative reference to keep on your desk.
Tools and resources for this topic
- CCNP ENCOR 350-401 Official Cert Guide — The definitive ENCOR study resource by Brad Edgeworth. Covers enterprise infrastructure, virtualisation, and automation.